Manual SVG Animation
Intro
Adding some simple animations to your SVGs can make a big impact. There are a lot of libraries and applications out there that can help you do this, but sometimes it's simpler just to do things by hand.
Organization
In your graphic editing program (probably Adobe Illustrator) simplify your SVG as much as possible. Then before you export it make sure that all of your groups and layers are named in a logical fashion. When you copy and paste the SVG into the code editor it will be easier to understand which elements and paths are which. The layer and group names in illustrator will be preserved in the SVG code.
You will want to copy and paste the SVG inline instead of importing it as a file. This will make it easier to manipulate the SVG with CSS and JavaScript.
I'm using React, so here is the SVG image pasted inside of a React component.
This animation takes a couple of paths from the illustration #api-db and #db-dash and then we create a couple of circles that will travel along those paths. The circles will fade in while standing still at the start of the path, then travel along the path, and then fade out while standing still at the end of the path. The circles will then reset and repeat the animation.
Sample Component
This component is relatively straightforward. If you are getting confused by the keyPoints/values think of it like this.
In this little diagram let's say that | represents a keyPoints, which is used to define the beginning and end of each "phase" of our circles animation.
|delay|fadeIn|travel|fadeOut|delay|
We have added an adjustable delay at the start and end of the animation so that the circles aren't all on top of each other on the path, and then they can delay before they run again, which makes it less apparent that it is a loop. With this method the circles will appear and travel in more organic seeming waves.
That translates to six | keyPoints, and we need to tell animate (which is animating opacity in this example) and animateMotion (which is animating the circle position) what we want the opacity and position to be at each of those keyPoints. That's what the values/keyPoints attribute is for. It's just a list of values that correspond to the keyPoints.
const AnimatedAutoReportDiagram = () => {
  let travelDurationSlow = 10;
  let travelDurationFast = 5;

  let generateFadeInTravelFadeOutCircle = (
    path,
    color,
    fadeInOutDuration,
    travelDuration,
    resetDelay,
    startDelay
  ) => {

    let totalTime =
      startDelay +
      fadeInOutDuration +
      travelDuration +
      fadeInOutDuration +
      resetDelay;
    let opacityZeroDelayEndKeyTime = startDelay / totalTime;
    let opacityFullTravelStartKeyTime =
      (startDelay + fadeInOutDuration) / totalTime;
    let opacityFullTravelEndKeyTime =
      (startDelay + fadeInOutDuration + travelDuration) / totalTime;
    let opacityZeroResetDelayBeginKeyTime =
      (startDelay + fadeInOutDuration + travelDuration + fadeInOutDuration) /
      totalTime;

    // keyTimes are always a relative range between 0 and 1. They are not absolute times. That's why we need these calculation functions to determine their values programmatically.
    let animateKeyTimes = `0;${opacityZeroDelayEndKeyTime};${opacityFullTravelStartKeyTime};${opacityFullTravelEndKeyTime};${opacityZeroResetDelayBeginKeyTime};1`;

    return (
      <circle
        // cx & cy coords not necessary as they are set by the animateMotion
        r="5"
        fill={color}
        className="animated-circle"
      >
        // we are trying to coordinate the opacity and motion animations
        // therefore they have the same number of keyFrames and identical keyTimes

        <animate
          attributeName="opacity"
          values="0;0;1;1;0;0"
          keyTimes={animateKeyTimes}
          dur={`${totalTime}s`}
          repeatCount="indefinite"
        />

        <animateMotion
          keyPoints="0;0;0;1;1;1"
          keyTimes={animateKeyTimes}
          dur={`${totalTime}s`}
          repeatCount="indefinite"
          calcMode="linear"
        >
          <mpath href={`#${path}`} />
        </animateMotion>
      </circle>
    );
  };

  return (
    <svg
      id="animated-diagram"
      xmlns="http://www.w3.org/2000/svg"
      viewBox="0 0 700 300"
    >
      <rect
        id="border"
        x="11.36"
        y="12.17"
        width="677.28"
        height="275.67"
        rx="12"
        ry="12"
      />

      <g id="connectors">
        <path
          id="api-db"
          className="cls-2"
          d="M532.6,156.82h-46.78c-5.82,0-10.55,4.72-10.55,10.55v34.18c0,5.82-4.72,10.55-10.55,10.55h-60.78"
        />
        <path
          id="db-dash"
          className="cls-2"
          d="M305.81,212.03h-62.21c-5.58,0-10.1-4.52-10.1-10.1v-34.78c0-5.58-4.52-10.1-10.1-10.1h-54.94"
        />

      </g>

      {generateFadeInTravelFadeOutCircle(
        "api-db",
        "var(--blue)",
        0.5,
        travelDurationSlow,
        1,
        0.5
      )}
      {generateFadeInTravelFadeOutCircle(
        "api-db",
        "var(--blue)",
        0.5,
        travelDurationSlow,
        2,
        1.5
      )}
      {generateFadeInTravelFadeOutCircle(
        "db-dash",
        "var(--blue)",
        0.5,
        travelDurationFast,
        1,
        0.5
      )}
      {generateFadeInTravelFadeOutCircle(
        "db-dash",
        "var(--blue)",
        0.5,
        travelDurationFast,
        2,
        1.5
      )}

    </svg>
  );
};

export default AnimatedAutoReportDiagram;
A few of the key things to recognize here are that we didn't hand code the keyTimes for the circles. That would have been extremely tedious. Instead we can create a function that generates the circles with their appropriate parameters and then just call that function for each circle we want to create. With the function we can designate which path we want the circle to follow, how long the animation phases should take (IE, how fast the circle should travel) etc etc.
This is a simplified example but it shows how we can combine multiple animations (opacity and motion) together into one cohesive element, pass in paths with variables, and generate animated elements with functions.
If you understand this example fully, you can extrapolate the method to create more complex animations.
Making Helper Tables
If you are having trouble visualizing the keyTimes and values for your animations, you can make a table to help you visualize it. Here is a table that I made for the example above.
Given this set of 6 Keypoints for our 5 stages of animation: |delay|fadeIn|travel|fadeOut|delay| we know that we want our table to have 6 columns, one for each Keypoint.
| -- | delayStart | delayEnd/fadeInStart | fadeInEnd/travelStart | travelEnd/fadeOutStart | fadeOutEnd/delayStart | delayEnd |
|---|---|---|---|---|---|---|
| opacity | 0 | 0 | 1 | 1 | 0 | 0 |
| motion | 0 | 0 | 0 | 1 | 1 | 1 |
For the motion attribute 0 represents the start of the path and 1 represents the end of the path. For the opacity attribute 0 represents an opacity of 0 and 1 represents an opacity of 1.
So checking this chart we can see that at the travel start keyframe the circle is at the start of the path, and then at the travel end keyframe it's at the end of the path.
The timing of the stages is set using the keyTimes attribute. The keyTimes attribute is a list of values that correspond to the keyPoints. So for the first circle we have a keyTimes attribute of 0;0;0;1;1;1. This means that the circle will start at the start of the path, and then stay there for the duration of the delay, and then travel along the path for the duration of the travel stage, and then stay at the end of the path for the duration of the delay, and then repeat.
Troubleshooting
If you are having an issue getting your animateMotion animation to work correctly on Safari browsers, you may be missing the calcMode="linear" attribute. This is required for Safari browsers to work correctly.
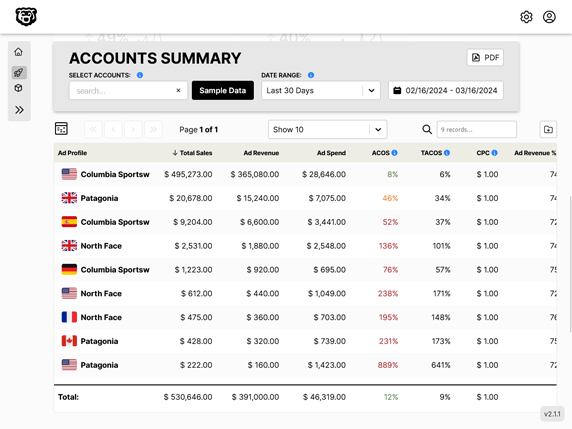
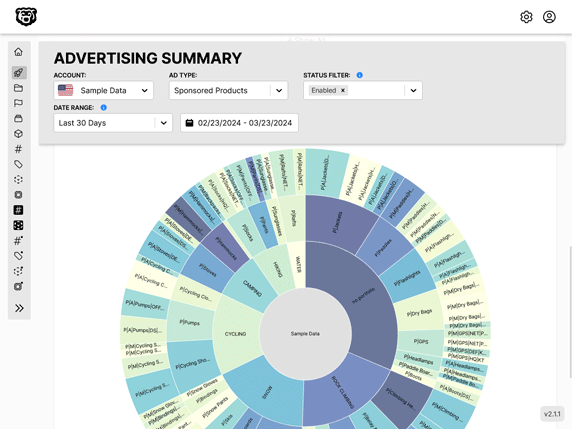
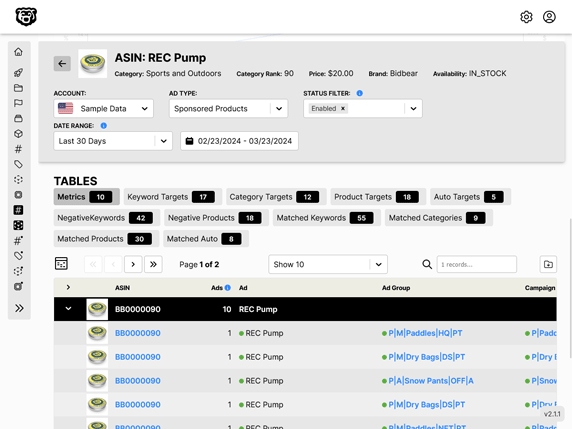
Automated Amazon Reports
Automatically download Amazon Seller and Advertising reports to a private database. View beautiful, on demand, exportable performance reports.