Python Data Manipulation and Visualization Techniques
Intro
These techniques assume that you are working with Jupyter notebooks.
Required Libraries
Almost all of these techniques require the use of the Pandas and numpy libraries for manipulation and seaborn and matplotlib.pyplot for visualization.
import pandas as pd
import numpy as np
import seaborn as sns
import matplotlib.pyplot as plt
Importing Data
Read and assign variables to CSV files like so. Assumes files are in same directory as notebook.
# import the csv files using pandas
features = pd.read_csv('Features_data_set.csv')
sales = pd.read_csv('sales_data_set.csv')
stores = pd.read_csv('stores_data_set.csv')
View Data
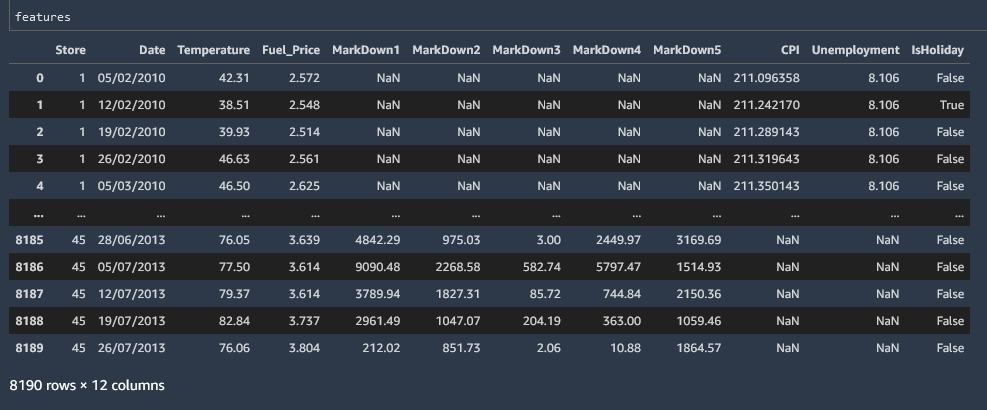
Data can be viewed by referencing the named variable.
features
.head() and .tail()
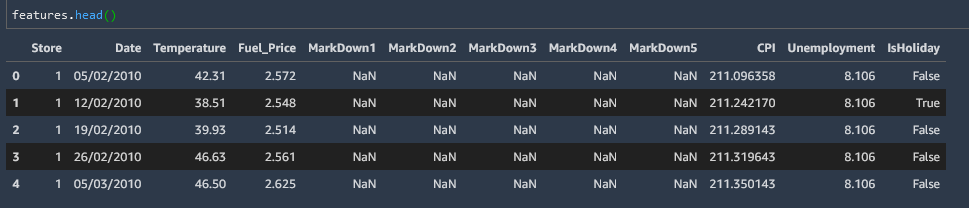
This can be inconvenient for large datasets, so to view the first or last five values in the table you can use the .head() or .tail() method.
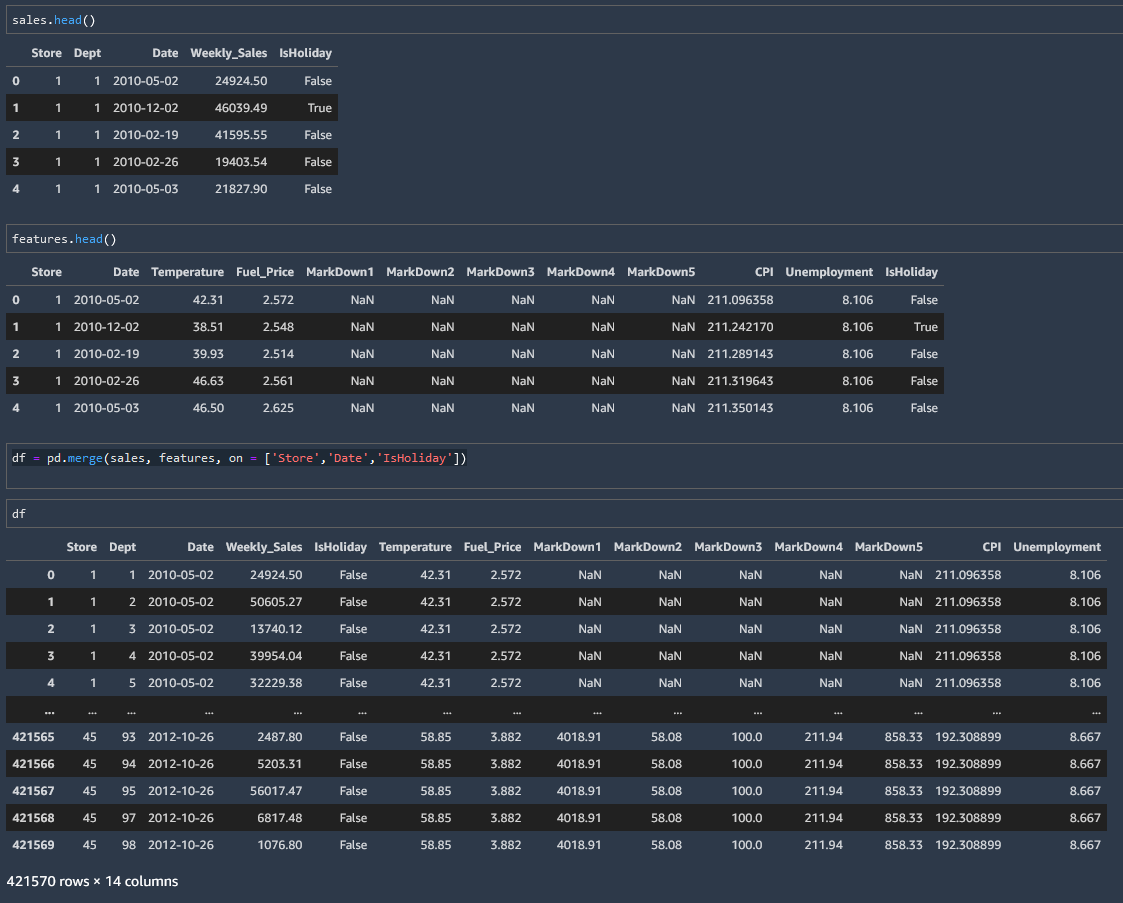
features.head()
Reference single column
You can reference a single column in the datafield just like you would name a key in a JSON object
features.Temperature.head()
or alternately
features['Temperature'].head()

.info()
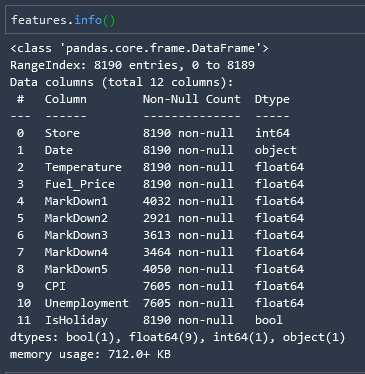
The .info() method will give you basic information about your columns, such as the datatype in the column as well as the value count and memory usage.
features.info()
.describe()
# Statistical summary of the DataField
salary_df.describe()

.shape()
Gives the number of rows and columns respectively.
features.shape

Split Data
Train/Test Split
Where X and y are named numerical datasets
from sklearn.model_selection import train_test_split

X_train, X_test, y_train, y_test = train_test_split(X, y, test_size = 0.2)
Outputs 4 named datasets with an 80/20 split for each set.
Combine Data
Convert Data
Datetime
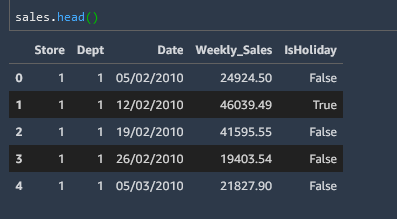
In this example we can convert a date column in object format to datetime format.
Here is what object format looks like.
and we convert it
# Change the datatype of 'date' column
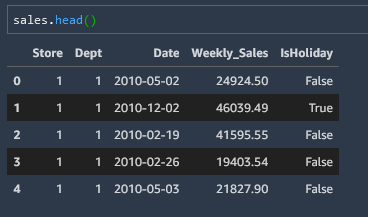
sales['Date'] = pd.to_datetime(sales['Date'])
and we can see our new format
Merge Datasets
One of the key things to consider when merging datasets with dates is that the date formats should match (for example datetime format).
In this example we are merging dataframe sales and dataframe features into one dataframe. They have columns Store, Date and IsHoliday in common.
df = pd.merge(sales, features, on = ['Store','Date','IsHoliday'])
Note that the datafields to merge do not have to have the same number of rows. For example we can merge the extremely short stores datafield into our new combined df datafield also, by instructing the merge method to merge on the "Store" column like so.
df = pd.merge(df, stores, on = ['Store'], how = 'left')
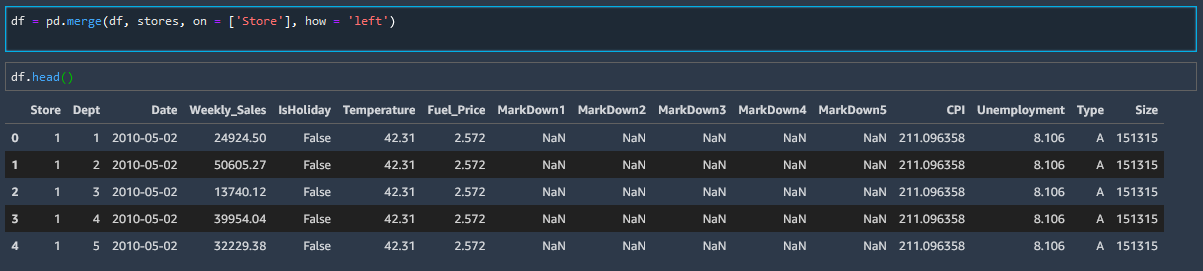
Note that there are only 48 stores (rows) in the stores datafield, and we have successfully merged that onto the datafield df with over 400,000 rows. Pandas simply knows to duplicate down the data as needed.
Split Datetime and Extract Month into new Column
We have merged our three csv files into one datafield assigned the value df. And merged a new column onto the end of the data called Month which we extracted from the date column with a get_month function.
# defining a function get_month which takes a datetime as an argument
def get_month(datetime):
    # and returns the second string split as an integer
    return int(str(datetime).split('-')[1])
and we can see an example of that working here
get_month('2020-12-31')
12
And we can then apply that function to our datafield df targeting the ['Date'] column
df['Month'] = df['Date'].apply(get_month)
Null Data
Null Data Heatmap
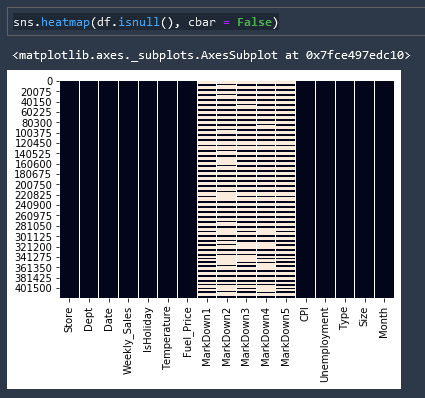
A very useful and common heatmap is a null values heatmap to give you an overall idea of the quality of your data.
Where datafield is df
sns.heatmap(df.isnull(), cbar = False)
Count Null Data
# check the number of non-null values in the dataframe
df.isnull().sum()

Fill Null Elements with 0
# Fill up NaN elements with zeros
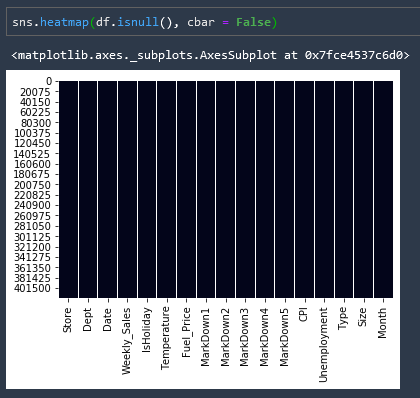
df = df.fillna(0)
and if we run our null elements heatmap again we can see that we have removed all null elements
Duplicate Data
Count Duplicate Data
# check the number of duplicated entries in the dataframe
df.duplicated().sum()
0
Randomly Sample Rows
It can be useful to sample a random selection of rows to see if a transformation has taken place correctly, since the .head and .tail method can show all identical results frequently. here we are pulling a random sample of ten rows in the column IsHoliday which has over 400000 entries
df['IsHoliday'].sample(n = 10)
97778     False
194631    False
389239    False
271913    False
101684    False
27555     False
359851    False
19615     False
404862    False
209253     True
Name: IsHoliday, dtype: bool
Convert DataFields to Markdown Tables
You may want to convert a datafield into Markdown so that you can embed it on a website (like this one). To do that you can use the following little function.
s = pd.Series(["elk", "pig", "dog", "quetzal"], name="animal")

print(s.to_markdown())
| animal | |
|---|---|
| 0 | elk |
| 1 | pig |
| 2 | dog |
| 3 | quetzal |
Move Column to Position 0
## Move target "weekly_sales" into first column
# remove column into its own object
first_column = df.pop('Weekly_Sales')

# insert column using insert(position,column_name,
# first_column) function
df.insert(0, 'Weekly_Sales', first_column)
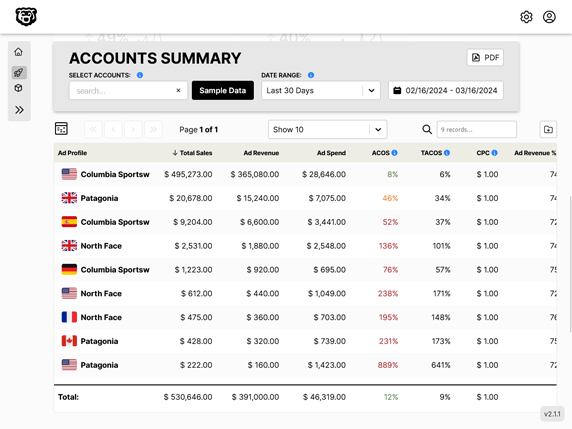
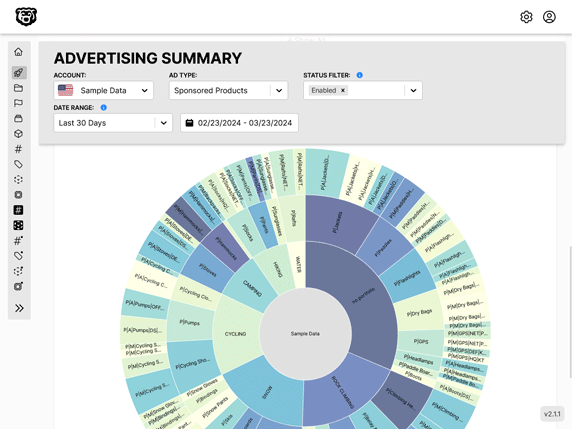
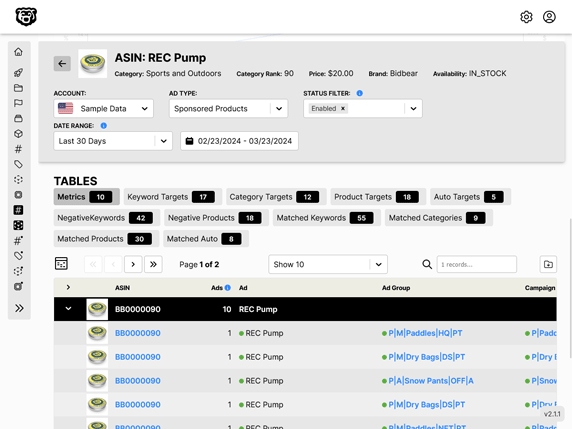
Automated Amazon Reports
Automatically download Amazon Seller and Advertising reports to a private database. View beautiful, on demand, exportable performance reports.