D3 Sunburst Chart
Intro
In the last post we learned important concepts of circular charts (pie chart) such as arcs, radians and ordinal scales.
Now let us work on creating a sunburst chart using the example from the D3 website as a basis.
Scaffolding
Because we are going to be creating this chart inside a React project, and we also are going to make the chart responsive, let's start by scaffolding out a component so that we have a workspace.
We can go ahead and break this out into another post also to save us more time in the future.
Ncoughlin: D3 Responsive Chart Scaffold
And lets go ahead and bring that in here with a chopped down version of the sample data from the official example.
import React, { useRef, useEffect, useState } from "react";
// libraries
import * as d3 from "d3";
// redux
import { connect } from "react-redux";

const Sunburst = (props) => {
  const data = {
    name: "flare",
    children: [
      {
        name: "analytics",
        children: [
          {
            name: "cluster",
            children: [
              { name: "AgglomerativeCluster", size: 3938 },
              { name: "CommunityStructure", size: 3812 },
              { name: "HierarchicalCluster", size: 6714 },
              { name: "MergeEdge", size: 743 },
            ],
          },
          {
            name: "graph",
            children: [
              { name: "BetweennessCentrality", size: 3534 },
              { name: "LinkDistance", size: 5731 },
              { name: "MaxFlowMinCut", size: 7840 },
              { name: "ShortestPaths", size: 5914 },
              { name: "SpanningTree", size: 3416 },
            ],
          },
          {
            name: "optimization",
            children: [{ name: "AspectRatioBanker", size: 7074 }],
          },
        ],
      },
      {
        name: "animate",
        children: [
          { name: "Easing", size: 17010 },
          { name: "FunctionSequence", size: 5842 },
          {
            name: "interpolate",
            children: [
              { name: "ArrayInterpolator", size: 1983 },
              { name: "ColorInterpolator", size: 2047 },
              { name: "DateInterpolator", size: 1375 },
              { name: "Interpolator", size: 8746 },
              { name: "MatrixInterpolator", size: 2202 },
              { name: "NumberInterpolator", size: 1382 },
              { name: "ObjectInterpolator", size: 1629 },
              { name: "PointInterpolator", size: 1675 },
              { name: "RectangleInterpolator", size: 2042 },
            ],
          },
          { name: "ISchedulable", size: 1041 },
          { name: "Parallel", size: 5176 },
          { name: "Pause", size: 449 },
          { name: "Scheduler", size: 5593 },
          { name: "Sequence", size: 5534 },
          { name: "Transition", size: 9201 },
          { name: "Transitioner", size: 19975 },
          { name: "TransitionEvent", size: 1116 },
          { name: "Tween", size: 6006 },
        ],
      },
      {
        name: "data",
        children: [
          {
            name: "converters",
            children: [
              { name: "Converters", size: 721 },
              { name: "DelimitedTextConverter", size: 4294 },
              { name: "GraphMLConverter", size: 9800 },
              { name: "IDataConverter", size: 1314 },
              { name: "JSONConverter", size: 2220 },
            ],
          },
          { name: "DataField", size: 1759 },
          { name: "DataSchema", size: 2165 },
          { name: "DataSet", size: 586 },
          { name: "DataSource", size: 3331 },
          { name: "DataTable", size: 772 },
          { name: "DataUtil", size: 3322 },
        ],
      },
      {
        name: "display",
        children: [
          { name: "DirtySprite", size: 8833 },
          { name: "LineSprite", size: 1732 },
          { name: "RectSprite", size: 3623 },
          { name: "TextSprite", size: 10066 },
        ],
      },
    ],
  };

  // Element References
  const svgRef = useRef(null);
  const svgContainer = useRef(null); // The PARENT of the SVG

  // State to track width and height of SVG Container
  const [width, setWidth] = useState();
  const [height, setHeight] = useState();

  // calculate width and height of container
  const getSvgContainerSize = () => {
    const newWidth = svgContainer.current.clientWidth;
    setWidth(newWidth);

    const newHeight = svgContainer.current.clientHeight;
    setHeight(newHeight);
  };

  // resizer
  useEffect(() => {
    // get 'width' and 'height' on render
    getSvgContainerSize();
    // listen for resize changes
    window.addEventListener("resize", getSvgContainerSize);
    // cleanup event listener
    return () => window.removeEventListener("resize", getSvgContainerSize);
  }, []);

  // draw chart
  useEffect(() => {
    // D3 Code

    // Dimensions
    let dimensions = {
      width: width,
      height: height,
      margins: 50,
    };

    dimensions.containerWidth = dimensions.width - dimensions.margins * 2;
    dimensions.containerHeight = dimensions.height - dimensions.margins * 2;

    // selections
    const svg = d3
      .select(svgRef.current)
      .classed("sunburst-chart-svg", true)
      .attr("width", dimensions.width)
      .attr("height", dimensions.height);

    // clear all previous content on refresh
    const everything = svg.selectAll("*");
    everything.remove();

    const container = svg
      .append("g")
      .classed("sunburst-chart-inner-container", true)
      .attr(
        "transform",
        `translate(${dimensions.margins}, ${dimensions.margins})`
      );

    // rest of d3 code ...

    // const someElement = container.append('g')
    //  ...
  }, [width, height]); // redraw chart if data or dimensions change

  const renderContent = () => {
    return (
      <div className="sunburst-chart-container">
        <div ref={svgContainer} className="sunburst-chart-svg-container">
          <svg ref={svgRef} />
        </div>
      </div>
    );
  };

  return <>{renderContent()}</>;
};

// map state to props
function mapState(state) {
  return {};
}

// map actions to props
const mapDispatch = {};

// connect store
export default connect(mapState, mapDispatch)(Sunburst);
Ok this is a great start. Let's start going through the official example linked above and start breaking it down.
Data Formatting
The first section is all about formatting our data. It uses ternary operators to determine which D3 methods should be used to format the data into the format the chart requires (hierarchical). The first two options are about converting tabular data into hierarchical data. The third option assumes that the data is already in the correct hierarchical format.
// If id and parentId options are specified, or the path option, use d3.stratify
// to convert tabular data to a hierarchy; otherwise we assume that the data is
// specified as an object {children} with nested objects (a.k.a. the “flare.json”
// format), and use d3.hierarchy.
 const root = path != null ? d3.stratify().path(path)(data)
    : id != null || parentId != null ? d3.stratify().id(id).parentId(parentId)(data)
    : d3.hierarchy(data, children);
Our chart will not need to be so modular. We can assume that we are going to be feeding it correctly formatted data. In fact we will make sure of it. Therefore we can simplify this section to the following.
const root = d3.hierarchy(data);
d3.hierarchy()
Let's take a moment to understand what this .hierarchy method is doing for us.
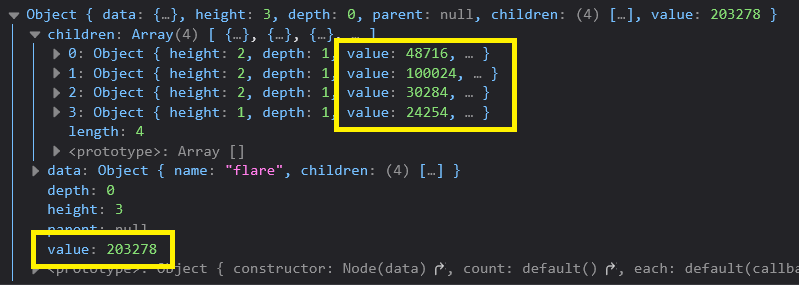
Essentially it consumes a JSON object and returns another object with additional data for each node. For example each node now contains the original data, as well as the depth and height of the node in the tree, as well as a copy of the parent node and all of the children nodes.

And looking into this, it is not merely giving each node an ID and then referencing that node ID as the parent or children, it is literally creating a whole other copy of the data at each point in the tree. Meaning that the object which is returned is exponentially larger than the original object.
That seems incredibly inefficient and like it could lead to a lot of performance issues but ok.
Let's also note briefly that the .hierarchy method takes a second argument, which is the accessor for the children, in case in your data it is not already named "children". Ours is, and will be, so we can omit the second argument.
Area Encoding
This next part is a bit confusing.
// Compute the values of internal nodes by aggregating from the leaves.
value == null ? root.count() : root.sum(d => Math.max(0, value(d)));
In this context value is actually the value accessor.
So what is happening here is that we are checking to see if a value accessor has been specified. If it has not we run the .count() method on the root node which counts all the leaves and adds that as the value in the root object.
I can assume that later on all the leaves will be given an equal area (equal size slices) and the value here is just used to calculate that area.
If a value accessor has been specified we run the .sum() method on all of those values which adds them all up and sets it as the value on all the nodes in the root object.
I find the way they have written this to be a bit confusing so I'm re-writing this like so
// add area encoding values to root
const valueAccessor = (d) => d.size;
// compute the values of internal nodes by aggregating from the leaves.
valueAccessor == null
  ? root.count()
  : root.sum((d) => Math.max(0, valueAccessor(d)));
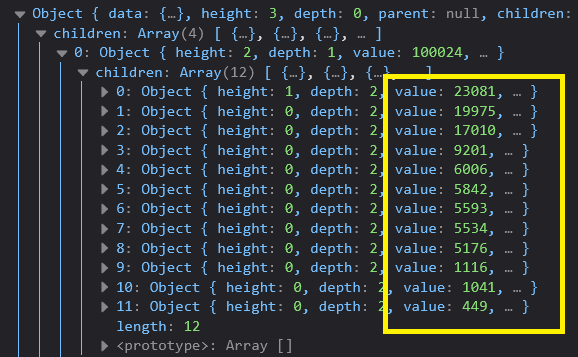
And if we run that we can see that our root object now has values added to all the nodes indicating the sum of all the sizes in those nodes.
These values will be used later to determine the radian value of each arc. IE, how big each slice is going to be.
So we are just continuing to shape our root object before we use it to actually draw the Sunburst.
Leaf Sorting
The next bit is more straightforward, we are going to sort the leaves based on the value we just calculated so that they are not ordered randomly, but in a pleasing descending layout.
// Sort the leaves (typically by descending value for a pleasing layout).
if (sort != null) root.sort(sort);
Which references the sort method specified above
sort = (a, b) => d3.descending(a.value, b.value)
Again, we do not need to check to see if a sort method has been supplied. We can just call this method as we see fit.
// sort leaves by value
root.sort((a, b) => d3.descending(a.value, b.value))
and we can see that our leaves have been sorted into descending order
Compute Partition Layout
This next step is a big important one. We currently have all our data in the proper hierarchical format, and we have values for each node, and the nodes are sorted. Which means that we can calculate the values we need to draw each of the nodes.
Based on what we learned before, we know that to drawn an Arc we need a few pieces of information. We need the starting and ending angle (in radians), and we need the inner and outer radius (from the origin). If we have those four numbers we can draw a whole bunch of little Arcs!
The following section does just that.
// Compute the partition layout. Note polar coordinates: x is angle and y is radius.
d3.partition().size([2 * Math.PI, radius])(root);
The partition method is determining what portion of the total area (circle) each little Arc will fill. The default of this method is it gives x and y coordinates out of 1 total.
However since we are using a circle, we actually want a portion of the total radians in the circle (2π radians is = 360°), and then the portion of the total radius.
Thus the chaining of the .size() method to convert our result into these measurements respectively.
So for me I can calculate the radius like so
// outer radius
dimensions.radius =
  Math.min(
    dimensions.containerWidth,
    dimensions.containerHeight
  ) / 2;
Which is just the lesser of the container width or height divided by two. Then we call the partition() method which calculates our partitions.
If we check the root object again we now have starting and ending angles in radians, and inner and outer radius.
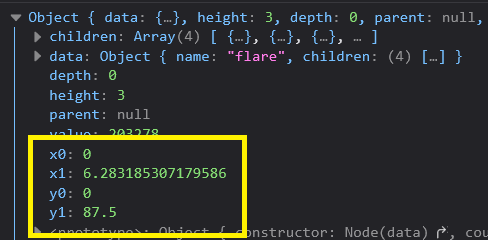
Let's just clarify what these variables mean real quick.
x0 = starting angle in radians
x1 = ending angle in radians
y0 = inner radius
y1 = outer radius
The coordinates in the screenshot are for the root in the middle of the chart, which should be a complete circle. There are 6.28 radians in a circle, so we can see that this is going to go all the way around and make a full circle. The inner radius is zero so it will start at the origin, and the outer radius is going to be 87.5 pixels from the origin. This is all exactly what we would expect.
We now have everything we need to draw the Arcs... except for colors!
Color Scales
This part is fun, we get to pick which color scale we would like to use.
color = d3.interpolateRainbow
// Construct a color scale.
if (color != null) {
  color = d3.scaleSequential([0, root.children.length - 1], color).unknown(fill);
  root.children.forEach((child, i) => child.index = i);
}
The sample given uses the interpolate rainbow scale.
We can remove the variables from the options and hardcode them, and change our color scheme to give us the following.
// construct color scale
const defaultFill = "#ccc"
const colorScheme = d3.interpolateSpectral
const color = d3
  .scaleSequential([0, root.children.length - 1], colorScheme)
  .unknown(defaultFill);
// give all children of root an identical index for coloration
root.children.forEach((child, i) => (child.index = i));
and that last little line there takes all the children of the root and assigns all the children of that node an identical index, which will be referenced by the color scale, so that all children in each branch will have the same color.
Arc Generator
Now we get into the part where we are actually drawing the Sunburst. We start by creating an arc generator, which will take the x an y values that we generated with the partition method on each node to draw an arc.
// Construct an arc generator.
const arc = d3.arc()
  .startAngle(d => d.x0)
  .endAngle(d => d.x1)
  .padAngle(d => Math.min((d.x1 - d.x0) / 2, 2 * padding / radius))
  .padRadius(radius / 2)
  .innerRadius(d => d.y0)
  .outerRadius(d => d.y1 - padding);
Which is all pretty straightforward given what we learned in our pie chart post. We just have to swap out a couple of the dimension variables to match our format.
The next section is just creating the SVG, which is also straightforward. We have already covered that in our scaffold.
const svg = d3.create("svg")
  .attr("viewBox", [
    marginRight - marginLeft - width / 2,
    marginBottom - marginTop - height / 2,
    width,
    height
  ])
  .attr("width", width)
  .attr("height", height)
  .attr("style", "max-width: 100%; height: auto; height: intrinsic;")
  .attr("font-family", "sans-serif")
  .attr("font-size", 10)
  .attr("text-anchor", "middle");
Render Nodes
The next two sections create a link element for each node in the root, and then append an arc onto each link element.
const cell = svg
  .selectAll("a")
  .data(root.descendants())
  .join("a")
    .attr("xlink:href", link == null ? null : d => link(d.data, d))
    .attr("target", link == null ? null : linkTarget);

cell.append("path")
    .attr("d", arc)
    .attr("fill", color ? d => color(d.ancestors().reverse()[1]?.index) : fill)
    .attr("fill-opacity", fillOpacity);
This is quite nicely done. The link portion is a bit tricky as they need to dynamically change the link for each node. They do this by passing in a function for the link that takes the nodes data as the first argument and the whole node as the second argument like this.
link: (d, n) => n.children
  ? `https://github.com/prefuse/Flare/tree/master/flare/src/${n.ancestors().reverse().map(d => d.data.name).join("/")}`
  : `https://github.com/prefuse/Flare/blob/master/flare/src/${n.ancestors().reverse().map(d => d.data.name).join("/")}.as`
We can replace all that with a static link for the time being and come back to this when we are ready to generate our own links.
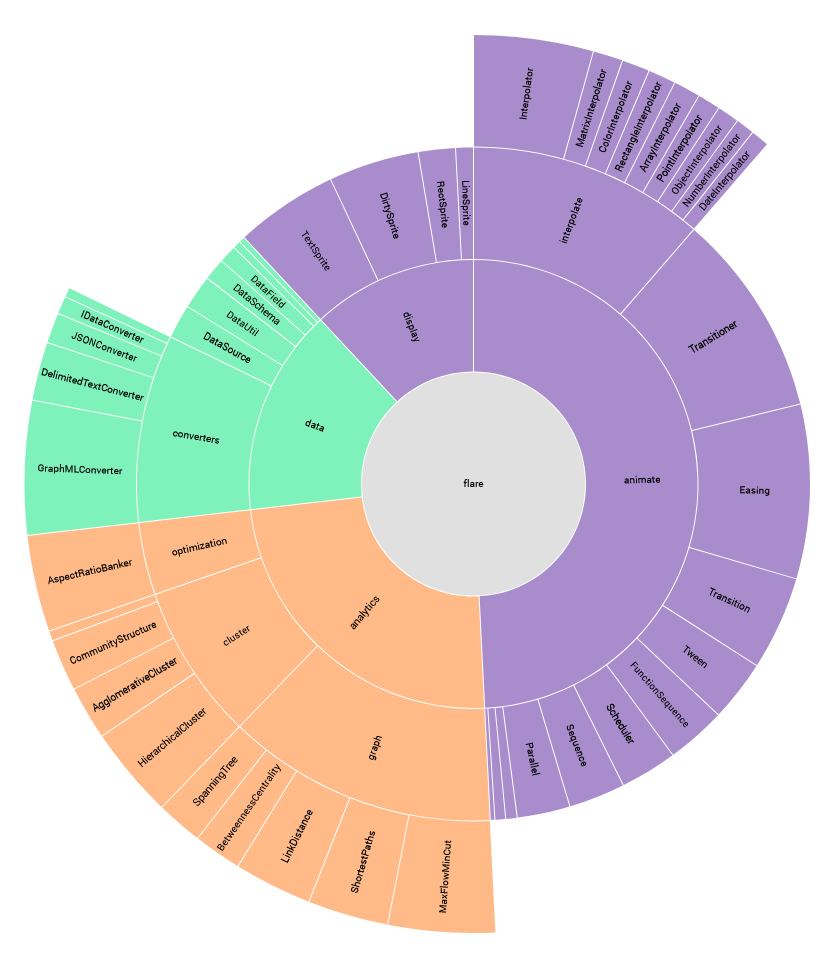
The arc appending is actually very straightforward. When we add that we finally get some visuals.

Looking very nice. Missing labels obviously, although that is the next section.
Labels
The labels are pretty straightforward. Here is my tweaked version with some additional notes for clarity of what is happening.
// label is simply the given name
const labelAccessor = (d) => d.name
const label = labelAccessor

// add labels
if (label != null)
  node
    // filter cells without room for label
    .filter((d) => ((d.y0 + d.y1) / 2) * (d.x1 - d.x0) > 10)
    .append("text")
    .classed("sunburst-node-label", true)
    // rotate and position labels
    .attr("transform", (d) => {
      // except base node
      if (!d.depth) return;
      const x = (((d.x0 + d.x1) / 2) * 180) / Math.PI;
      const y = (d.y0 + d.y1) / 2;
      return `rotate(${x - 90}) translate(${y},0) rotate(${
        x < 180 ? 0 : 180
      })`;
    })
    .attr("dy", "0.32em")
    .text((d) => label(d.data, d));

// title builder (title is hover text)
const title = (d, n) => `${n.ancestors().reverse().map(d => d.data.name).join(">")}\n${n.value.toLocaleString("en")}`
// add title
if (title != null) node.append("title").text((d) => title(d.data, d));
One potential improvement we could make here is to create actual tooltips to get a better hover box instead of the default browser title. Ok for now though.
I've also shifted the label font size and arc opacity code to our CSS by appending classes on the respective elements.
Hover Effect
At this point we are done and have successfully re-created the Sunburst chart inside a React component which is also responsive.
One quick improvement we can make before moving on is to class the arcs so that we can target them with CSS and give them hover effects.
// append arcs to link elements
    node
      .append("path")
      .classed("sunburst-node-arc", true) // highlight-line
      .attr("d", arc)
      .attr(
        "fill",
        color ? (d) => color(d.ancestors().reverse()[1]?.index) : defaultFill
      )
.sunburst-node-arc {
  fill-opacity: 0.6;
}
.sunburst-node-arc:hover {
  fill-opacity: 0.3;
}
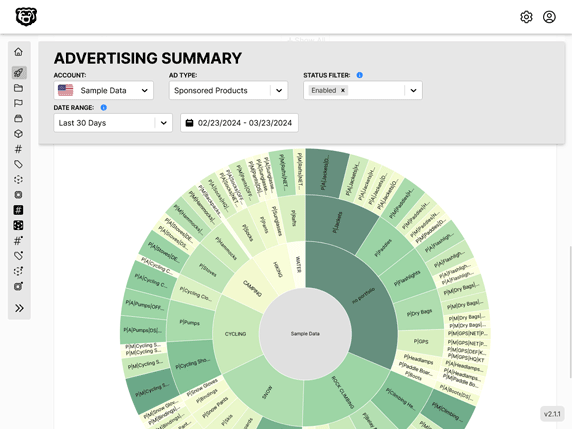
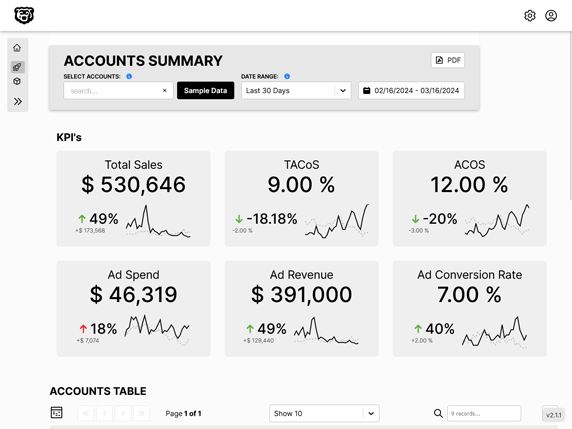
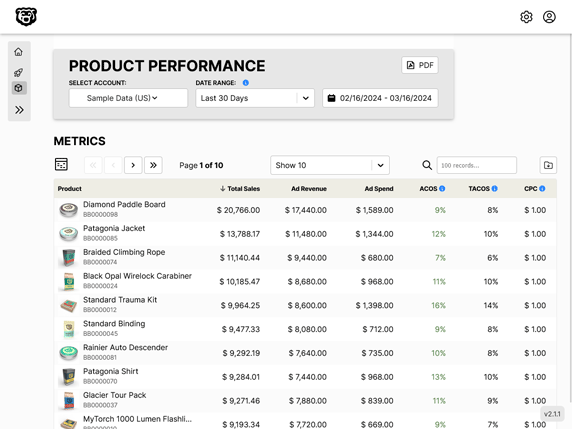
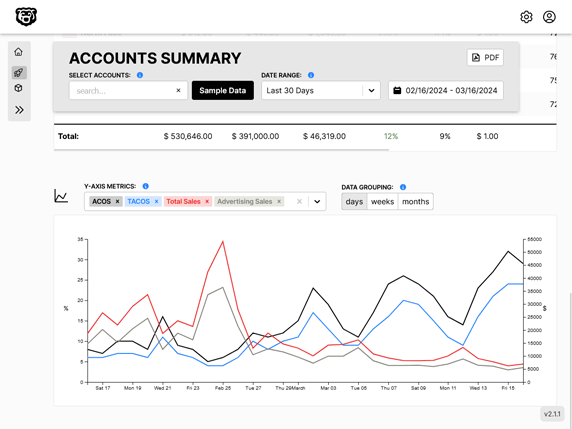
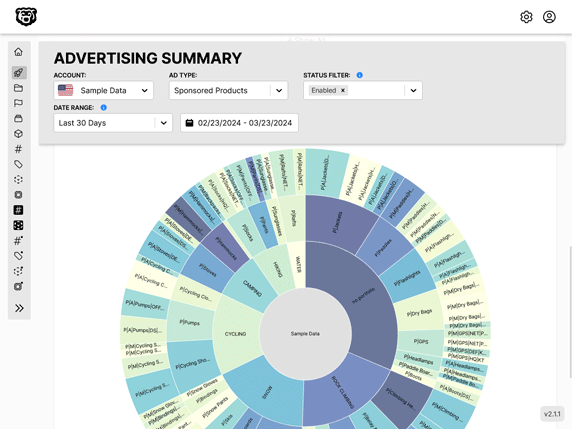
Automated Amazon Reports
Automatically download Amazon Seller and Advertising reports to a private database. View beautiful, on demand, exportable performance reports.