D3 React Responsive Chart
Intro
Previously we learned how to integrate a D3 line chart into a React component. That was great, but we have one big deficiency at this point. The dimensions of our chart were static. We want our chart to detect the size of it's parent element (containing element) and draw the SVG elements and calculate scales according to that size. In addition we want our component to continuously listen for changes to it's size (the user resizes the window) and re-render it's size and scales continuously to accommodate the changes.
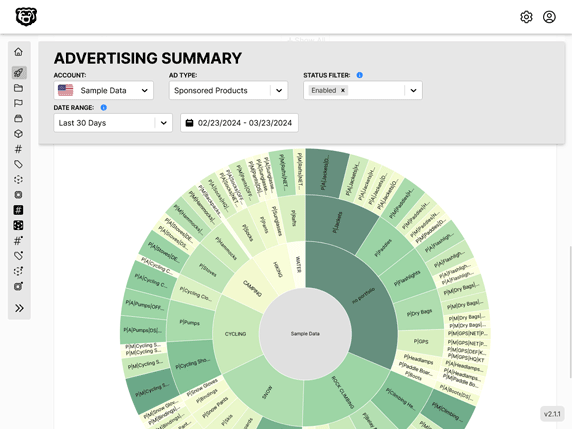
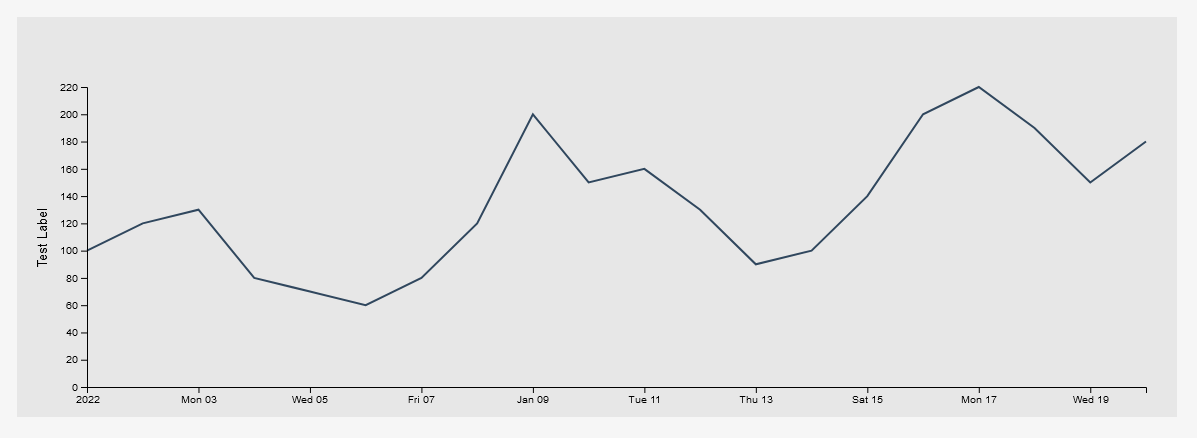
Here is a preview of our perfectly scaling responsive D3 Line Chart
Pure D3 Method
Let me start by saying this is not my preferred method if you are using React, but in the interest of providing multiple options i'm including it here.
There is a method done purely with Javascript and D3 that was originally created by Brendan Sudol
Brendan Sudol: Responsive D3.js
Which was then discussed by Ben ClinkinBeard
Ben Clinkinbear: Make Any Chart Responsive With One Function
This method provides you with a function that you can append to your SVG selection that listens for changes to the parent element and then resizes the SVG accordingly. It's pretty smart, but it has some major deficiencies. What it is doing is simply resizing the viewbox of the SVG in response to changes to the parent element. That works great for the SVG shapes, but it also completely destroys the legibility of the scales (if your graph has them) and it locks the aspect ratio of the SVG. This is also undesirable. If I have a Line Chart and I click drag to resize the width, I don't want the height of my chart to change.
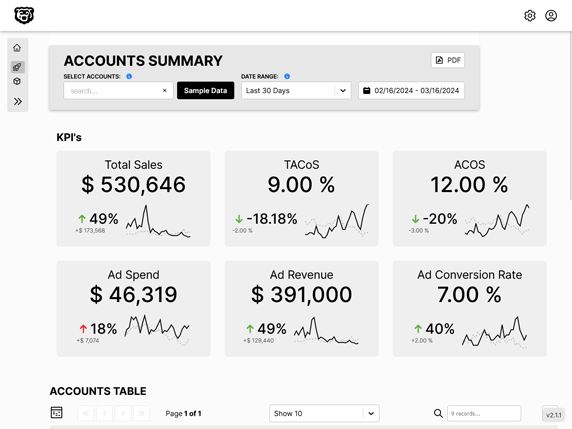
Let me show you what I mean. Here is an implementation of this function in our line chart. If I start with the dimensions like this
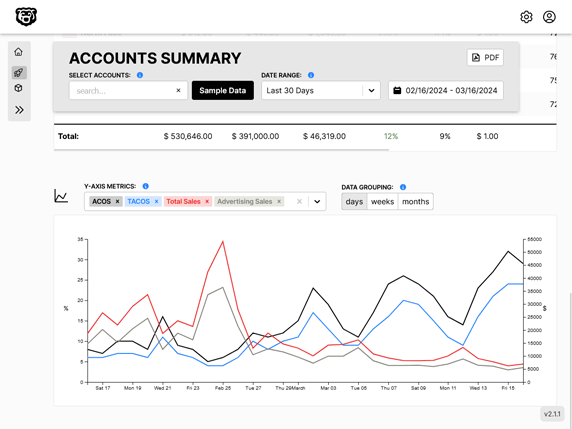
And then I drag the window smaller I get this

Which is completely illegible, and that's not even taking into account what this has done to my tooltips, which require my scales to be updated to position themselves correctly.
In short, we cannot simply change the size of the viewbox to get a correctly scaling responsive chart.
It is worth noting that if you refresh the page at the smaller resolution the chart will scale correctly to fit the parent element, but only on the initial render.
This method does offer us a brief glimpse of the true solution to this problem however. We need to detect the size of the element containing our graph, and listen for changes to that element, and then re-render the graph with those new measurements.
The React Way
Detecting changes... re-rendering... these all sound like things that React is great at. And in fact we can use the tools that React gives us to implement a true perfect scaling solution.
What we want to do is add a useRef hook reference to our SVG's parent element, and then create a function that detects the width and height of that element. We will call that function getSvgContainerSize. We use the useState hook to track and update the state of those dimensions. Lastly we use the useEffect hook to fire these elements for us.
Note that there are two similarly named containers in this code sample. The svgContainer is the parent of the SVG element. The container is the chart line container (the child of the SVG element).
import React, { useRef, useEffect, useState } from "react";
import * as d3 from "d3";

// *********************************************************************
// Data.date must be provided in ASC order (ascending, oldest to newest)
// *********************************************************************
const LineChart = ({ Data, data_type }) => {
  // Element References
  const svgRef = useRef(null);
  const tooltipRef = useRef(null);
  const svgContainer = useRef(null); // The PARENT of the SVG

  // State to track width and height of SVG Container
  const [width, setWidth] = useState();
  const [height, setHeight] = useState();

  // This function calculates width and height of the container
  const getSvgContainerSize = () => {
    const newWidth = svgContainer.current.clientWidth;
    setWidth(newWidth);

    const newHeight = svgContainer.current.clientHeight;
    setHeight(newHeight);
  };

  useEffect(() => {
    // detect 'width' and 'height' on render
    getSvgContainerSize();
    // listen for resize changes, and detect dimensions again when they change
    window.addEventListener("resize", getSvgContainerSize);
    // cleanup event listener
    return () => window.removeEventListener("resize", getSvgContainerSize);
  }, []);

  useEffect(() => {
    // D3 Code

    // data_type variables switch
    let xAccessor;
    let yAccessor;
    let yAxisLabel;
    let parseDate;

    // variable accessor depending on datatype
    switch (data_type) {
      case "test":
        parseDate = d3.timeParse("%Y%m%d");
        xAccessor = (d) => parseDate(d.date);
        yAccessor = (d) => d.Impressions;
        yAxisLabel = "Test Label";
        break;
      case "impressions":
        parseDate = d3.timeParse("%Y%m%d");
        xAccessor = (d) => parseDate(d.date);
        yAccessor = (d) => d.Impressions;
        yAxisLabel = "Impressions";
        break;
      default:
        throw new Error(`${data_type} is an unknown data_type prop`);
    }

    // Dimensions
    let dimensions = {
      width: width, // width from state
      height: height, // height from state
      margins: 50,
    };

    dimensions.containerWidth = dimensions.width - dimensions.margins * 2;
    dimensions.containerHeight = dimensions.height - dimensions.margins * 2;

    // Selections
    const svg = d3
      .select(svgRef.current)
      .classed("line-chart-svg", true)
      .attr("width", dimensions.width)
      .attr("height", dimensions.height);

    // clear all previous content on refresh
    const everything = svg.selectAll("*");
    everything.remove();

    const container = svg
      .append("g")
      .classed("container", true)
      .attr("transform", `translate(${dimensions.margins}, ${dimensions.margins})`);

    const tooltip = d3.select(tooltipRef.current);
    const tooltipDot = container
      .append("circle")
      .classed("tool-tip-dot", true)
      .attr("r", 5)
      .attr("fill", "#fc8781")
      .attr("stroke", "black")
      .attr("stroke-width", 2)
      .style("opacity", 0)
      .style("pointer-events", "none");

    // Scales
    const yScale = d3
      .scaleLinear()
      .domain([0, d3.max(Data, yAccessor)])
      .range([dimensions.containerHeight, 0])
      .nice();
    const xScale = d3.scaleTime().domain(d3.extent(Data, xAccessor)).range([0, dimensions.containerWidth]);

    // Line Generator
    const lineGenerator = d3
      .line()
      .x((d) => xScale(xAccessor(d)))
      .y((d) => yScale(yAccessor(d)));

    // Draw Line
    container
      .append("path")
      .datum(Data)
      .attr("d", lineGenerator)
      .attr("fill", "none")
      .attr("stroke", "#30475e")
      .attr("stroke-width", 2);

    // Axis
    const yAxis = d3.axisLeft(yScale).tickFormat((d) => `${d}`);

    const yAxisGroup = container.append("g").classed("yAxis", true).call(yAxis);

    // y-axis label
    yAxisGroup
      .append("text")
      .attr("x", -dimensions.containerHeight / 2)
      .attr("y", -dimensions.margins + 10)
      .attr("fill", "black")
      .text(yAxisLabel)
      .style("font-size", ".8rem")
      .style("transform", "rotate(270deg)")
      .style("text-anchor", "middle");

    const xAxis = d3.axisBottom(xScale);

    container
      .append("g")
      .classed("xAxis", true)
      .style("transform", `translateY(${dimensions.containerHeight}px)`)
      .call(xAxis);

    // Tooltip
    container
      .append("rect")
      .classed("mouse-tracker", true)
      .attr("width", dimensions.containerWidth)
      .attr("height", dimensions.containerHeight)
      .style("opacity", 0)
      .on("touchmouse mousemove", function (event) {
        const mousePos = d3.pointer(event, this);

        // x coordinate stored in mousePos index 0
        const date = xScale.invert(mousePos[0]);

        // Custom Bisector - left, center, right
        const dateBisector = d3.bisector(xAccessor).center;

        const bisectionIndex = dateBisector(Data, date);
        //console.log(bisectionIndex);
        // math.max prevents negative index reference error
        const hoveredIndexData = Data[Math.max(0, bisectionIndex)];

        // Update Image
        tooltipDot
          .style("opacity", 1)
          .attr("cx", xScale(xAccessor(hoveredIndexData)))
          .attr("cy", yScale(yAccessor(hoveredIndexData)))
          .raise();

        tooltip
          .style("display", "block")
          .style("top", `${yScale(yAccessor(hoveredIndexData)) - 50}px`)
          .style("left", `${xScale(xAccessor(hoveredIndexData))}px`);

        tooltip.select(".data").text(`${yAccessor(hoveredIndexData)}`);

        const dateFormatter = d3.timeFormat("%B %-d, %Y");

        tooltip.select(".date").text(`${dateFormatter(xAccessor(hoveredIndexData))}`);
      })
      .on("mouseleave", function () {
        tooltipDot.style("opacity", 0);
        tooltip.style("display", "none");
      });
  }, [Data, data_type, width, height]); // redraw chart if data or dimensions change

  return (
    <div ref={svgContainer} className="line-chart"> // highlight-line
      <svg ref={svgRef} />
      <div ref={tooltipRef} className="lc-tooltip">
        <div className="data"></div>
        <div className="date"></div>
      </div>
    </div>
  );
};

export default LineChart;
Also note at the end there that we added the width and height states to the D3 charts useEffect triggers, because even though up to this point we were detecting and saving the width and height in state every time it changed, we weren't actually telling our D3 code to re-render until we listened for changes to those states on the D3 codes useEffect block.
Also note that we cleaned up the event listener in our dimension detecting/setting useEffect block. Anytime you add an event listener a giant alarm bell should be going off in your head that you need to also remove it. Without removing the previous event listener we are stacking a new one for literally every pixel change in the dimensions of the parent element, which if you are clicking and dragging is... many. So many event listeners. You will get crashes if you aren't removing them.
So how does it work?
It works perfectly. Our scales are continuously updated along with our chart dimensions. Tooltips are positioned correctly etc etc. This is a clearly superior method of making our chart responsive, as the changes in the dimensions automatically flow down to all of the elements that rely on those dimensions for positioning. In fact we only had to modify three lines of our previously static D3 code block to implement this functionality, which makes it extremely easy to implement as well.
Automated Amazon Reports
Automatically download Amazon Seller and Advertising reports to a private database. View beautiful, on demand, exportable performance reports.