D3 Line Chart
Intro
Let's build a line chart with D3!

Scaffolding
Our line chart code will be very similar to our previous two charts, however now we will be dealing with time on the x-axis. Let's scaffold out a quick chart with our y values already positioned.
async function draw() {
  // Data
  const dataset = await d3.csv('data.csv')

  const xAccessor = d => d.date
  const yAccessor = d => d.close

  // Dimensions
  let dimensions = {
    width: 1000,
    height: 500,
    margins: 50,
  };

  dimensions.ctrWidth = dimensions.width - dimensions.margins * 2
  dimensions.ctrHeight = dimensions.height - dimensions.margins * 2

  // Draw Image
  const svg = d3.select('#chart')
    .append("svg")
    .attr("width", dimensions.width)
    .attr("height", dimensions.height)

  const ctr = svg.append("g") // <g>
    .attr(
      "transform",
      `translate(${dimensions.margins}, ${dimensions.margins})`
    )

  // Scales
  const yScale = d3.scaleLinear()
    .domain(d3.extent(dataset, yAccessor))
    .range([dimensions.ctrHeight, 0])
    .nice()
}

draw()
Time Scale & Data Parse
When it comes to dates, we need to understand that Javascript expects dates to be in a specific format, and our data may not be in that format. We need to use a special scaleTime scale and parse our date format with timeParse method.
In short, we must make sure that our date data has been converted to a proper date format, and then feed that into a special scale called scaleTime. This takes a huge amount of the heavy lifting involved with time based graphs.
async function draw() {
  // Data
  const dataset = await d3.csv('data.csv')

  // Accessors
  const parseDate = d3.timeParse('%Y-%m-%d')
  const xAccessor = d => parseDate(d.date)
  const yAccessor = d => parseInt(d.close)

  // Dimensions
  let dimensions = {
    width: 1000,
    height: 500,
    margins: 50,
  };

  dimensions.containerWidth = dimensions.width - dimensions.margins * 2
  dimensions.containerHeight = dimensions.height - dimensions.margins * 2

  // Draw Image
  const svg = d3.select('#chart')
    .append("svg")
    .attr("width", dimensions.width)
    .attr("height", dimensions.height)

  const container = svg.append("g") // <g>
    .attr(
      "transform",
      `translate(${dimensions.margins}, ${dimensions.margins})`
    )

  // Scales
  const yScale = d3.scaleLinear()
    .domain(d3.extent(dataset, yAccessor))
    .range([dimensions.containerHeight, 0])
    .nice()

  const xScale = d3.scaleTime()
    .domain(d3.extent(dataset, xAccessor))
    .range([0, dimensions.containerWidth])
}

draw()
Drawing A Line (generator)
In D3 a generator is a function that can generate a path. Once that path has been created we must append a SVG path element and set it's data with the line generator. The path element is the only SVG element that can use path information.
The line data that is generated is then joined to the path with the datum method. This is similar to join, but for paths.
async function draw() {
  // Data
  const dataset = await d3.csv('data.csv')

  // Accessors
  const parseDate = d3.timeParse('%Y-%m-%d')
  const xAccessor = d => parseDate(d.date)
  const yAccessor = d => parseInt(d.close)

  // Dimensions
  let dimensions = {
    width: 1000,
    height: 500,
    margins: 50,
  };

  dimensions.containerWidth = dimensions.width - dimensions.margins * 2
  dimensions.containerHeight = dimensions.height - dimensions.margins * 2

  // Draw Image
  const svg = d3.select('#chart')
    .append("svg")
    .attr("width", dimensions.width)
    .attr("height", dimensions.height)

  const container = svg.append("g") // <g>
    .attr(
      "transform",
      `translate(${dimensions.margins}, ${dimensions.margins})`
    )

  // Scales
  const yScale = d3.scaleLinear()
    .domain(d3.extent(dataset, yAccessor))
    .range([dimensions.containerHeight, 0])
    .nice()

  const xScale = d3.scaleTime()
    .domain(d3.extent(dataset, xAccessor))
    .range([0, dimensions.containerWidth])

  const lineGenerator = d3.line()
    .x((d) => xScale(xAccessor(d)))
    .y((d) => yScale(yAccessor(d)))

  container.append('path')
    .datum(dataset)
    .attr('d', lineGenerator)
    .attr('fill', "none")
    .attr('stroke', "#30475e")
    .attr('stroke-width', 2)

}

draw()
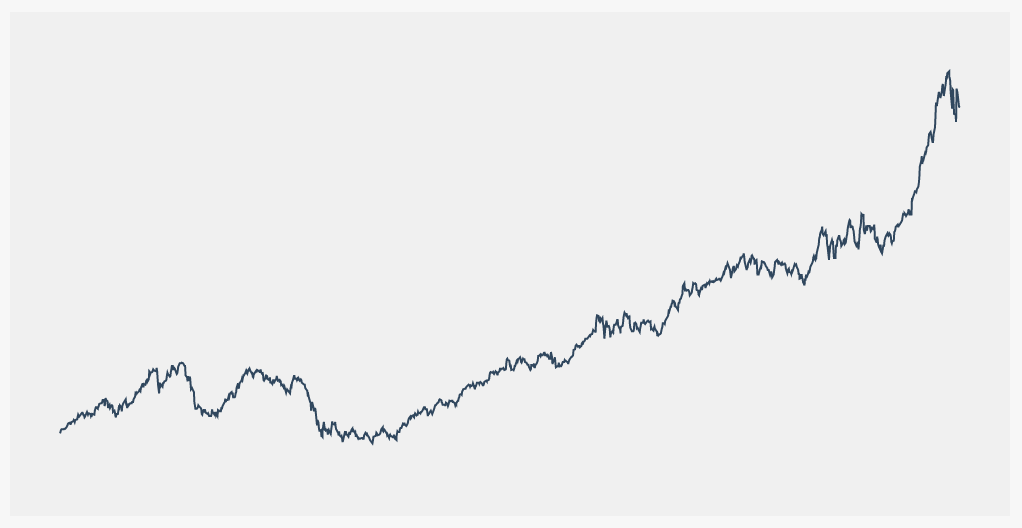
And we have a line chart
Adding the Axes
async function draw() {
  // Data
  const dataset = await d3.csv('data.csv')

  // Accessors
  const parseDate = d3.timeParse('%Y-%m-%d')
  const xAccessor = d => parseDate(d.date)
  const yAccessor = d => parseInt(d.close)

  // Dimensions
  let dimensions = {
    width: 1000,
    height: 500,
    margins: 50,
  };

  dimensions.containerWidth = dimensions.width - dimensions.margins * 2
  dimensions.containerHeight = dimensions.height - dimensions.margins * 2

  // Draw Image
  const svg = d3.select('#chart')
    .append("svg")
    .attr("width", dimensions.width)
    .attr("height", dimensions.height)

  const container = svg.append("g") // <g>
    .attr(
      "transform",
      `translate(${dimensions.margins}, ${dimensions.margins})`
    )

  // Scales
  const yScale = d3.scaleLinear()
    .domain(d3.extent(dataset, yAccessor))
    .range([dimensions.containerHeight, 0])
    .nice()

  const xScale = d3.scaleTime()
    .domain(d3.extent(dataset, xAccessor))
    .range([0, dimensions.containerWidth])

  const lineGenerator = d3.line()
    .x((d) => xScale(xAccessor(d)))
    .y((d) => yScale(yAccessor(d)))

  container.append('path')
    .datum(dataset)
    .attr('d', lineGenerator)
    .attr('fill', "none")
    .attr('stroke', "#30475e")
    .attr('stroke-width', 2)

  // Axis
  const yAxis = d3.axisLeft(yScale)
    .tickFormat(d => `$${d}`)

  container.append('g')
    .classed('yAxis', true)
    .call(yAxis)

  const xAxis = d3.axisBottom(xScale)

  container.append('g')
    .classed('xAxis', true)
    .style('transform', `translateY(${dimensions.containerHeight}px)` )
    .call(xAxis)
}

draw()

Tooltip
We are going to make a tooltip for the line chart that will display at whatever x-value the users mouse is hovering over. We are also going to make a dot that shows up on the line at that point.
Scaffold
<body>
  <div id="chart">
    <div id="tooltip">
      <div class="price"></div>
      <div class="date"></div>
    </div>
  </div>
</body>
#tooltip {
  border: 1px solid #ccc;
  position: absolute;
  padding: 10px;
  background-color: #fff;
  display: none;
  pointer-events: none;
}
.pointer (Mouse Position)
We need to add some new selections for our tooltip, and also some event listeners on our path. One of the new methods we will be using is the .pointer function, which returns the current coordinates of the mouse on the element.
const tooltip = d3.select("#tooltip");
const tooltipDot = container
  .append("circle")
  .attr("r", 5)
  .attr("fill", "#fc8781")
  .attr("stroke", "black")
  .attr("stroke-width", 2)
  .style("opacity", 0)
  .style('pointer-events', 'none')
// Line
  container
    .append("path")
    .datum(dataset)
    .attr("d", lineGenerator)
    .attr("fill", "none")
    .attr("stroke", "#30475e")
    .attr("stroke-width", 2)
    .on('touchmouse mousemove', function(event){
      const mousePos = d3.pointer(event, this)
      console.log(mousePos)
    })
    .on('mouseleave', function(event){

    })
and now we can see that as we hover over the line we get the coordinates of the mouse at that position relative to the container.
One slight issue here however is that the user has to hover over the actual line, which can be difficult if the line is very fine like it is here. It would be better if we could hover anywhere on the chart.
To accomplish this we can create a clear rectangle that sits on top of the graph, covering the whole area of the container, and we can place our mouse events onto that object.
async function draw() {
  // Data
  const dataset = await d3.csv("data.csv");

  // Accessors
  const parseDate = d3.timeParse("%Y-%m-%d");
  const xAccessor = (d) => parseDate(d.date);
  const yAccessor = (d) => parseInt(d.close);

  // Dimensions
  let dimensions = {
    width: 1000,
    height: 500,
    margins: 50,
  };

  dimensions.containerWidth = dimensions.width - dimensions.margins * 2;
  dimensions.containerHeight = dimensions.height - dimensions.margins * 2;

  // Draw Image
  const svg = d3
    .select("#chart")
    .append("svg")
    .attr("width", dimensions.width)
    .attr("height", dimensions.height);

  // Selections
  const container = svg
    .append("g")
    .attr(
      "transform",
      `translate(${dimensions.margins}, ${dimensions.margins})`
    );

  const tooltip = d3.select("#tooltip");
  const tooltipDot = container
    .append("circle")
    .attr("r", 5)
    .attr("fill", "#fc8781")
    .attr("stroke", "black")
    .attr("stroke-width", 2)
    .style("opacity", 0)
    .style('pointer-events', 'none')

  // Scales
  const yScale = d3
    .scaleLinear()
    .domain(d3.extent(dataset, yAccessor))
    .range([dimensions.containerHeight, 0])
    .nice();

  const xScale = d3
    .scaleTime()
    .domain(d3.extent(dataset, xAccessor))
    .range([0, dimensions.containerWidth]);

  // Line Generator
  const lineGenerator = d3
    .line()
    .x((d) => xScale(xAccessor(d)))
    .y((d) => yScale(yAccessor(d)));

  // Line
  container
    .append("path")
    .datum(dataset)
    .attr("d", lineGenerator)
    .attr("fill", "none")
    .attr("stroke", "#30475e")
    .attr("stroke-width", 2)


  // Axis
  const yAxis = d3.axisLeft(yScale).tickFormat((d) => `$${d}`);

  container.append("g").classed("yAxis", true).call(yAxis);

  const xAxis = d3.axisBottom(xScale);

  container
    .append("g")
    .classed("xAxis", true)
    .style("transform", `translateY(${dimensions.containerHeight}px)`)
    .call(xAxis);

  // Tooltip
  container.append('rect')
    .attr('width', dimensions.containerWidth)
    .attr('height', dimensions.containerHeight)
    .style('opacity', 0)
    .on('touchmouse mousemove', function(event){
      const mousePos = d3.pointer(event, this)
      console.log(mousePos)
    })
    .on('mouseleave', function(event){

    })
}

draw();
It's important that this rectangle is placed at the end like this, as the elements are rendered in order, with the latest elements on top, and we need this rectangle on top.
Next we need to work on generating the co-ordinates for our tooltip, so we need to take a quick sidebar to learn about bisectors.
Bisectors
A bisector is a function that helps us locate where to insert an element into an array to maintain a sorted array. Say we are pushing a number into a sorted array, a pushed number always appears the end of the array, and now the array is no longer sorted. We want to insert the number into the correct position in the array so that it remains sorted.
.bisect
We can use the D3 bisect function to solve this problem.
Say we want to insert the number 35 into this array [10, 20, 30, 40, 50] . We could do the following
const numbers = [10, 20, 30, 40, 50]
const spliceIndex = d3.bisect(numbers, 35) // 3

numbers.splice(spliceIndex, 0, 35)
// [10, 20, 30, 35, 40, 50]
We won't be using the bisect function to insert a value into an array, but we will be using it to find a specific index in an array. Keep that in mind.
Tooltip Coordinates
Now that we have an overlay that captures the position of the users mouse, we want to find the set in our dataset that position most closely relates to. To do that we will convert our x pixel value back to it's data value, and then search the dataset using bisect for the closest index.
scale.invert()
Our scale objects have a method available called .inverse which will allow us to put in the pixel value and get back the original data value.
  // Tooltip
  container.append('rect')
    .attr('width', dimensions.containerWidth)
    .attr('height', dimensions.containerHeight)
    .style('opacity', 0)
    .on('touchmouse mousemove', function(event){
      const mousePos = d3.pointer(event, this)
      // x coordinate stored in mousePos index 0
      const date = xScale.invert(mousePos[0])
      console.log(date);
    })
    .on('mouseleave', function(event){

    })
Now if we scroll over the chart we are logging the date corresponding with the x-coordinate instead of the pixel value. We have the x data value equivalent of our x pixel position. Now we will use a custom bisector to find the index in our dataset that most closely relates to this x data value.
Get Dataset Index (custom bisector)
We want to find the index in our dataset that corresponds with the x data value we just calculated. We could try something like this.
  container.append('rect')
    .attr('width', dimensions.containerWidth)
    .attr('height', dimensions.containerHeight)
    .style('opacity', 0)
    .on('touchmouse mousemove', function(event){
      const mousePos = d3.pointer(event, this)
      // x coordinate stored in mousePos index 0
      const date = xScale.invert(mousePos[0])

      const index = d3.bisect(dataset, date) // highlight-line
    })
    .on('mouseleave', function(event){

    })
However this won't work, not only do the date formats not match, but our dataset is full of objects, which doesn't work with the .bisect method, which only takes numbers. We need to make a custom bisector.
  // Tooltip
  container.append('rect')
    .attr('width', dimensions.containerWidth)
    .attr('height', dimensions.containerHeight)
    .style('opacity', 0)
    .on('touchmouse mousemove', function(event){
      const mousePos = d3.pointer(event, this)
      // x coordinate stored in mousePos index 0
      const date = xScale.invert(mousePos[0])

      // Custom Bisector - left, center, right <= bisector options
      const dateBisector = d3.bisector(xAccessor).left
      const bisectionIndex = dateBisector(dataset, date)
      const hoveredIndexData = dataset[bisectionIndex - 1]

      console.log(hoveredIndexData)
    })
    .on('mouseleave', function(event){

    })
We want the bisectionIndex minus 1, because the bisection index is the index of where the new value would be inserted. But we don't want to insert a new value, we just want the index of the previous value, which is the value that matches our date that we are hovering.
Now when we hover we get the data value of both x and y that is closest to our hovering position.

We can use these values to position our tooltip and tooltip dot. Let's start with the dot.
  // Tooltip
  container.append('rect')
    .attr('width', dimensions.containerWidth)
    .attr('height', dimensions.containerHeight)
    .style('opacity', 0)
    .on('touchmouse mousemove', function(event){
      const mousePos = d3.pointer(event, this)
      // x coordinate stored in mousePos index 0
      const date = xScale.invert(mousePos[0])

      // Custom Bisector - left, center, right
      const dateBisector = d3.bisector(xAccessor).left
      const bisectionIndex = dateBisector(dataset, date)
      const hoveredIndexData = dataset[bisectionIndex - 1]

      // Update Image
      tooltipDot.style('opacity', 1)
        .attr('cx', xScale(xAccessor(hoveredIndexData)))
        .attr('cy', yScale(yAccessor(hoveredIndexData)))
    })
    .on('mouseleave', function(event){

    })

Now we can add the actual tooltip box with it's data
  // Tooltip
  container
    .append("rect")
    .attr("width", dimensions.containerWidth)
    .attr("height", dimensions.containerHeight)
    .style("opacity", 0)
    .on("touchmouse mousemove", function (event) {
      const mousePos = d3.pointer(event, this);
      // x coordinate stored in mousePos index 0
      const date = xScale.invert(mousePos[0]);

      // Custom Bisector - left, center, right
      const dateBisector = d3.bisector(xAccessor).left;
      const bisectionIndex = dateBisector(dataset, date);
      const hoveredIndexData = dataset[bisectionIndex - 1];

      // Update Image
      tooltipDot
        .style("opacity", 1)
        .attr("cx", xScale(xAccessor(hoveredIndexData)))
        .attr("cy", yScale(yAccessor(hoveredIndexData)))
        .raise();

      tooltip
        .style("display", "block")
        .style("top", `${yScale(yAccessor(hoveredIndexData)) - 50}px`)
        .style("left", `${xScale(xAccessor(hoveredIndexData))}px`);

      tooltip.select(".price").text(`$${yAccessor(hoveredIndexData)}`);

      const dateFormatter = d3.timeFormat("%B %-d, %Y");

      tooltip.select(".date").text(`${dateFormatter(xAccessor(hoveredIndexData))}`)
    })
    .on("mouseleave", function () {
      tooltipDot.style("opacity", 0);
      tooltip.style("display", "none");
    });
and the tooltip is now showing correctly.
d is undefined
We are receiving one small error, which is when we hover over the very left side of the container we are getting a d is undefined error, which means that we are calling an accessor and passing in an undefined variable. My guess is that when we are hovering over the very first item in the array (index 0) when we are assigning the hoveredIndexData variable in our custom bisector we are outputing -1 when we subtract 1 from 0.
// Custom Bisector - left, center, right
const dateBisector = d3.bisector(xAccessor).left;
const bisectionIndex = dateBisector(dataset, date);
const hoveredIndexData = dataset[bisectionIndex - 1]; // highlight-line
Of course there are no negative indexes in arrays, so that is probably our issue. Let's see if theres a quick way we can default to 0 if we go negative. There are many methods to accomplish this.
// Custom Bisector - left, center, right
const dateBisector = d3.bisector(xAccessor).left;
const bisectionIndex = dateBisector(dataset, date);
// math.max prevents negative index reference error
const hoveredIndexData = dataset[Math.max(0,bisectionIndex - 1)];
And testing that we have solved the problem.
Final Code
async function draw() {
  // Data
  const dataset = await d3.csv("data.csv");

  // Accessors
  const parseDate = d3.timeParse("%Y-%m-%d");
  const xAccessor = (d) => parseDate(d.date);
  const yAccessor = (d) => parseInt(d.close);

  // Dimensions
  let dimensions = {
    width: 1000,
    height: 500,
    margins: 50,
  };

  dimensions.containerWidth = dimensions.width - dimensions.margins * 2;
  dimensions.containerHeight = dimensions.height - dimensions.margins * 2;

  // Draw Image
  const svg = d3
    .select("#chart")
    .append("svg")
    .attr("width", dimensions.width)
    .attr("height", dimensions.height);

  // Selections
  const container = svg
    .append("g")
    .attr(
      "transform",
      `translate(${dimensions.margins}, ${dimensions.margins})`
    );

  const tooltip = d3.select("#tooltip");
  const tooltipDot = container
    .append("circle")
    .attr("r", 5)
    .attr("fill", "#fc8781")
    .attr("stroke", "black")
    .attr("stroke-width", 2)
    .style("opacity", 0)
    .style("pointer-events", "none");

  // Scales
  const yScale = d3
    .scaleLinear()
    .domain(d3.extent(dataset, yAccessor))
    .range([dimensions.containerHeight, 0])
    .nice();

  const xScale = d3
    .scaleTime()
    .domain(d3.extent(dataset, xAccessor))
    .range([0, dimensions.containerWidth]);

  // Line Generator
  const lineGenerator = d3
    .line()
    .x((d) => xScale(xAccessor(d)))
    .y((d) => yScale(yAccessor(d)));

  // Line
  container
    .append("path")
    .datum(dataset)
    .attr("d", lineGenerator)
    .attr("fill", "none")
    .attr("stroke", "#30475e")
    .attr("stroke-width", 2);

  // Axis
  const yAxis = d3.axisLeft(yScale).tickFormat((d) => `$${d}`);

  container.append("g").classed("yAxis", true).call(yAxis);

  const xAxis = d3.axisBottom(xScale);

  container
    .append("g")
    .classed("xAxis", true)
    .style("transform", `translateY(${dimensions.containerHeight}px)`)
    .call(xAxis);

  // Tooltip
  container
    .append("rect")
    .attr("width", dimensions.containerWidth)
    .attr("height", dimensions.containerHeight)
    .style("opacity", 0)
    .on("touchmouse mousemove", function (event) {
      const mousePos = d3.pointer(event, this);
      // x coordinate stored in mousePos index 0
      const date = xScale.invert(mousePos[0]);

      // Custom Bisector - left, center, right
      const dateBisector = d3.bisector(xAccessor).left;
      const bisectionIndex = dateBisector(dataset, date);
      // math.max prevents negative index reference error
      const hoveredIndexData = dataset[Math.max(0,bisectionIndex - 1)];

      // Update Image
      tooltipDot
        .style("opacity", 1)
        .attr("cx", xScale(xAccessor(hoveredIndexData)))
        .attr("cy", yScale(yAccessor(hoveredIndexData)))
        .raise();

      tooltip
        .style("display", "block")
        .style("top", `${yScale(yAccessor(hoveredIndexData)) - 50}px`)
        .style("left", `${xScale(xAccessor(hoveredIndexData))}px`);

      tooltip.select(".price").text(`$${yAccessor(hoveredIndexData)}`);

      const dateFormatter = d3.timeFormat("%B %-d, %Y");

      tooltip.select(".date").text(`${dateFormatter(xAccessor(hoveredIndexData))}`)
    })
    .on("mouseleave", function () {
      tooltipDot.style("opacity", 0);
      tooltip.style("display", "none");
    });
}

draw();
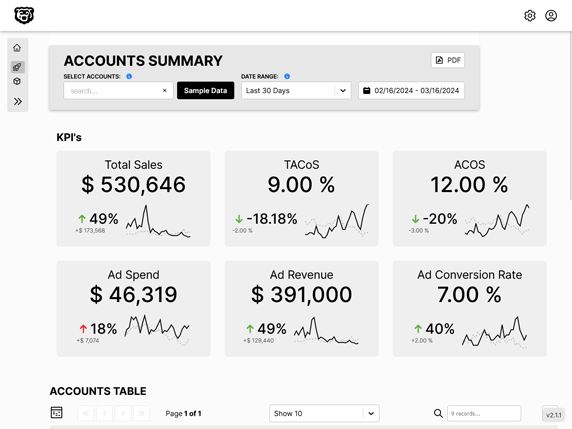
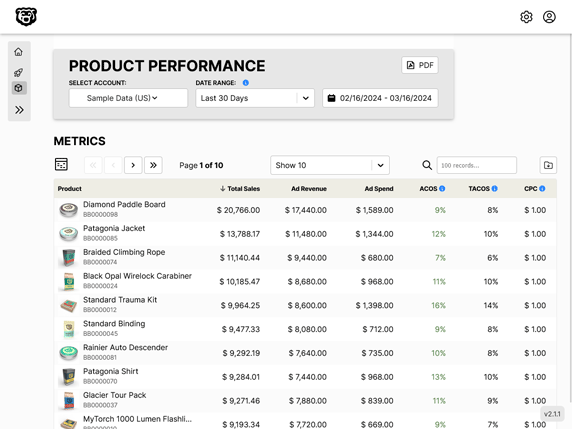
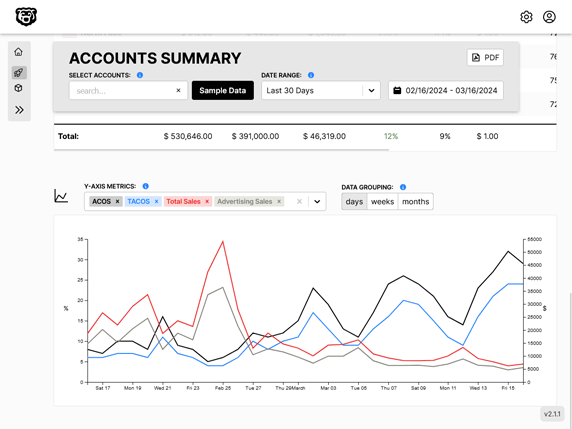
Automated Amazon Reports
Automatically download Amazon Seller and Advertising reports to a private database. View beautiful, on demand, exportable performance reports.