D3 Histogram with Animations
Intro
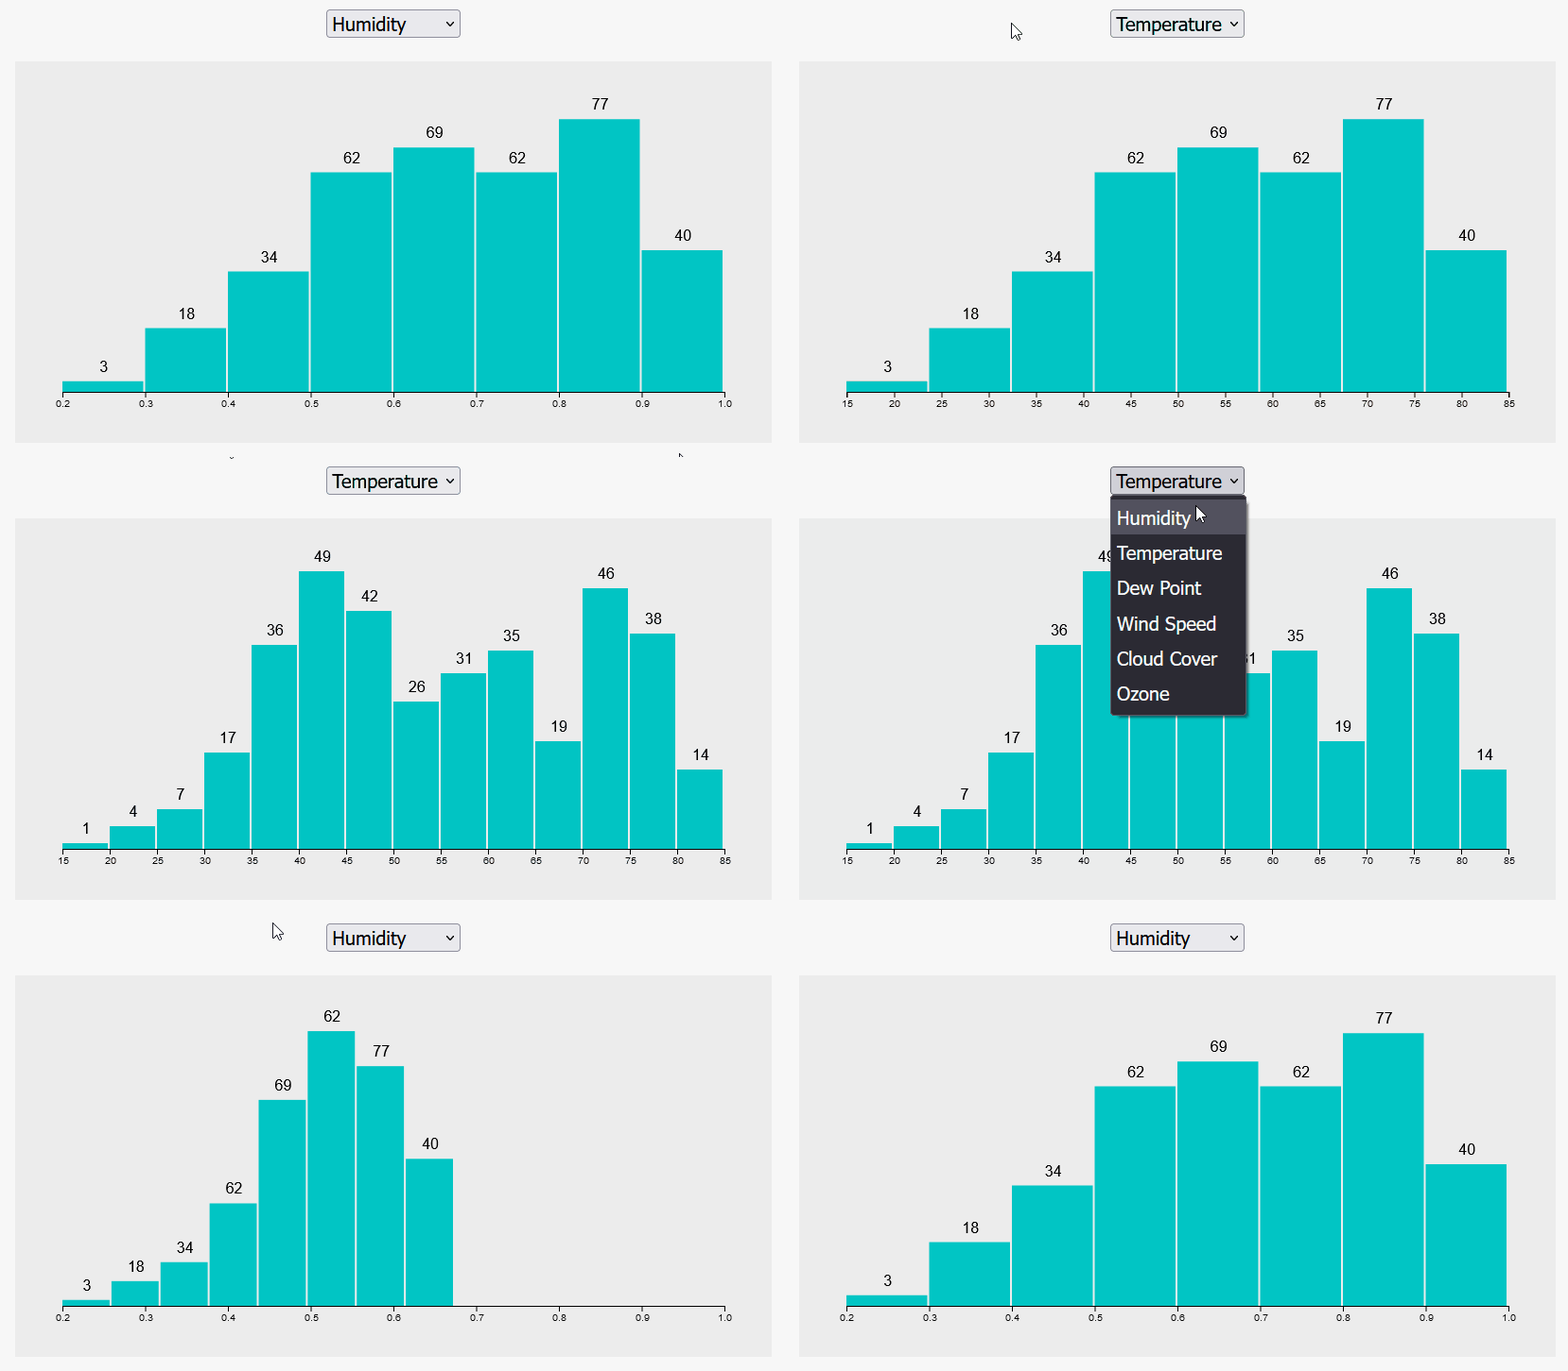
While SVG can be animated with CSS, there are properties on SVG that cannot. D3 has a transition library to assist with animations.
Transitions
.transition
The transition library can animate any property, synchronize animations, and sequence animations, as well as interrupt them.
Transitions are quite easy to implement, all we have to do is chain the transition method into our selections. The position in the chain is important however, we need to add it after the data has been joined, but before the items that will be animated.
async function draw(el) {
  // Data
  const dataset = await d3.json("data.json");

  // Dimensions
  let dimensions = {
    width: 800,
    height: 400,
    margins: 50,
  };

  dimensions.containerWidth = dimensions.width - dimensions.margins * 2;
  dimensions.containerHeight = dimensions.height - dimensions.margins * 2;

  binPadding = 2;

  // Draw Image
  const svg = d3
    .select(el)
    .append("svg")
    .attr("width", dimensions.width)
    .attr("height", dimensions.height);

  const container = svg
    .append("g")
    .classed("container", true)
    .attr(
      "transform",
      `translate(${dimensions.margins}, ${dimensions.margins})`
    );

  // Element Groups
  const labelsGroup = container.append("g").classed("bar-labels", true);

  const xAxisGroup = container
    .append("g")
    .classed("axis", true)
    .style("transform", `translateY(${dimensions.containerHeight}px)`);

  const barsGroup = container.append("g").classed("bars", true);

  // Histogram Function
  // elements that rely on data go here
  function histogram(metric) {
    // Accessors
    const xAccessor = (d) => d.currently[metric];
    const yAccessor = (d) => d.length;

    // Scales
    const xScale = d3
      .scaleLinear()
      .domain(d3.extent(dataset, xAccessor))
      .range([0, dimensions.containerWidth])
      .nice();

    const bin = d3
      .bin()
      .domain(xScale.domain()) // data domain
      .value(xAccessor) // data values
      .thresholds(10); // number of buckets

    const binnedDataset = bin(dataset);
    console.log(binnedDataset);

    const yScale = d3
      .scaleLinear()
      .domain([0, d3.max(binnedDataset, yAccessor)])
      .range([dimensions.containerHeight, 0])
      .nice();

    // Draw Bars
    barsGroup
      .selectAll("rect")
      .data(binnedDataset)
      .join("rect")
      .transition()  // highlight-line
      .attr(
        "width",
        (d) => d3.max([0, xScale(d.x1) - xScale(d.x0)]) - binPadding
      )
      .attr("height", (d) => dimensions.containerHeight - yScale(yAccessor(d)))
      .attr("x", (d) => xScale(d.x0))
      .attr("y", (d) => yScale(yAccessor(d)))
      .attr("fill", "#01c5c4");

    // Bar Labels
    labelsGroup
      .selectAll("text")
      .data(binnedDataset)
      .join("text")
      .transition()  // highlight-line
      // add half the size of the bar to center the text
      .attr("x", (d) => xScale(d.x0) + (xScale(d.x1) - xScale(d.x0)) / 2)
      .attr("y", (d) => yScale(yAccessor(d)) - 10)
      .text(yAccessor);

    // Draw Axis
    const xAxis = d3.axisBottom(xScale);

    xAxisGroup.transition().call(xAxis);  // highlight-line
  }

  // Select Handler
  d3.select("#metric").on("change", function (e) {
    e.preventDefault();

    histogram(this.value);
  });

  // default metric
  histogram("humidity");
}

draw("#chart");
And already all of our transitions are animated, however they are a bit funky. All of the animations are originating at the origin, instead of at the base of each item and moving upward.
_enter & _exit transitions
To solve this we will need to use what we learned in the D3 Fundamentals post about the _enter selection, which holds the data for items that have not been joined. We need to access that selection and apply the attributes that used before, but with a modified width and y-position so that the new bars start in their desired location and animate upwards.
// Draw Bars
    barsGroup
      .selectAll("rect")
      .data(binnedDataset)
      .join((enter) =>
        enter
          .append("rect")
          .attr(
            "width",
            (d) => d3.max([0, xScale(d.x1) - xScale(d.x0)]) - binPadding
          )
          .attr("height", 0)
          .attr("x", (d) => xScale(d.x0))
          .attr("y", dimensions.containerHeight)
          .attr("fill", "#01c5c4")
      )
      .transition()
      //.attr('width', ((dimensions.containerWidth / binnedDataset.length) - binPadding))
      .attr(
        "width",
        (d) => d3.max([0, xScale(d.x1) - xScale(d.x0)]) - binPadding
      )
      .attr("height", (d) => dimensions.containerHeight - yScale(yAccessor(d)))
      .attr("x", (d) => xScale(d.x0))
      .attr("y", (d) => yScale(yAccessor(d)))
      .attr("fill", "#01c5c4");
and now the bars are animating correctly, although the bar labels are still zooming in from the left.
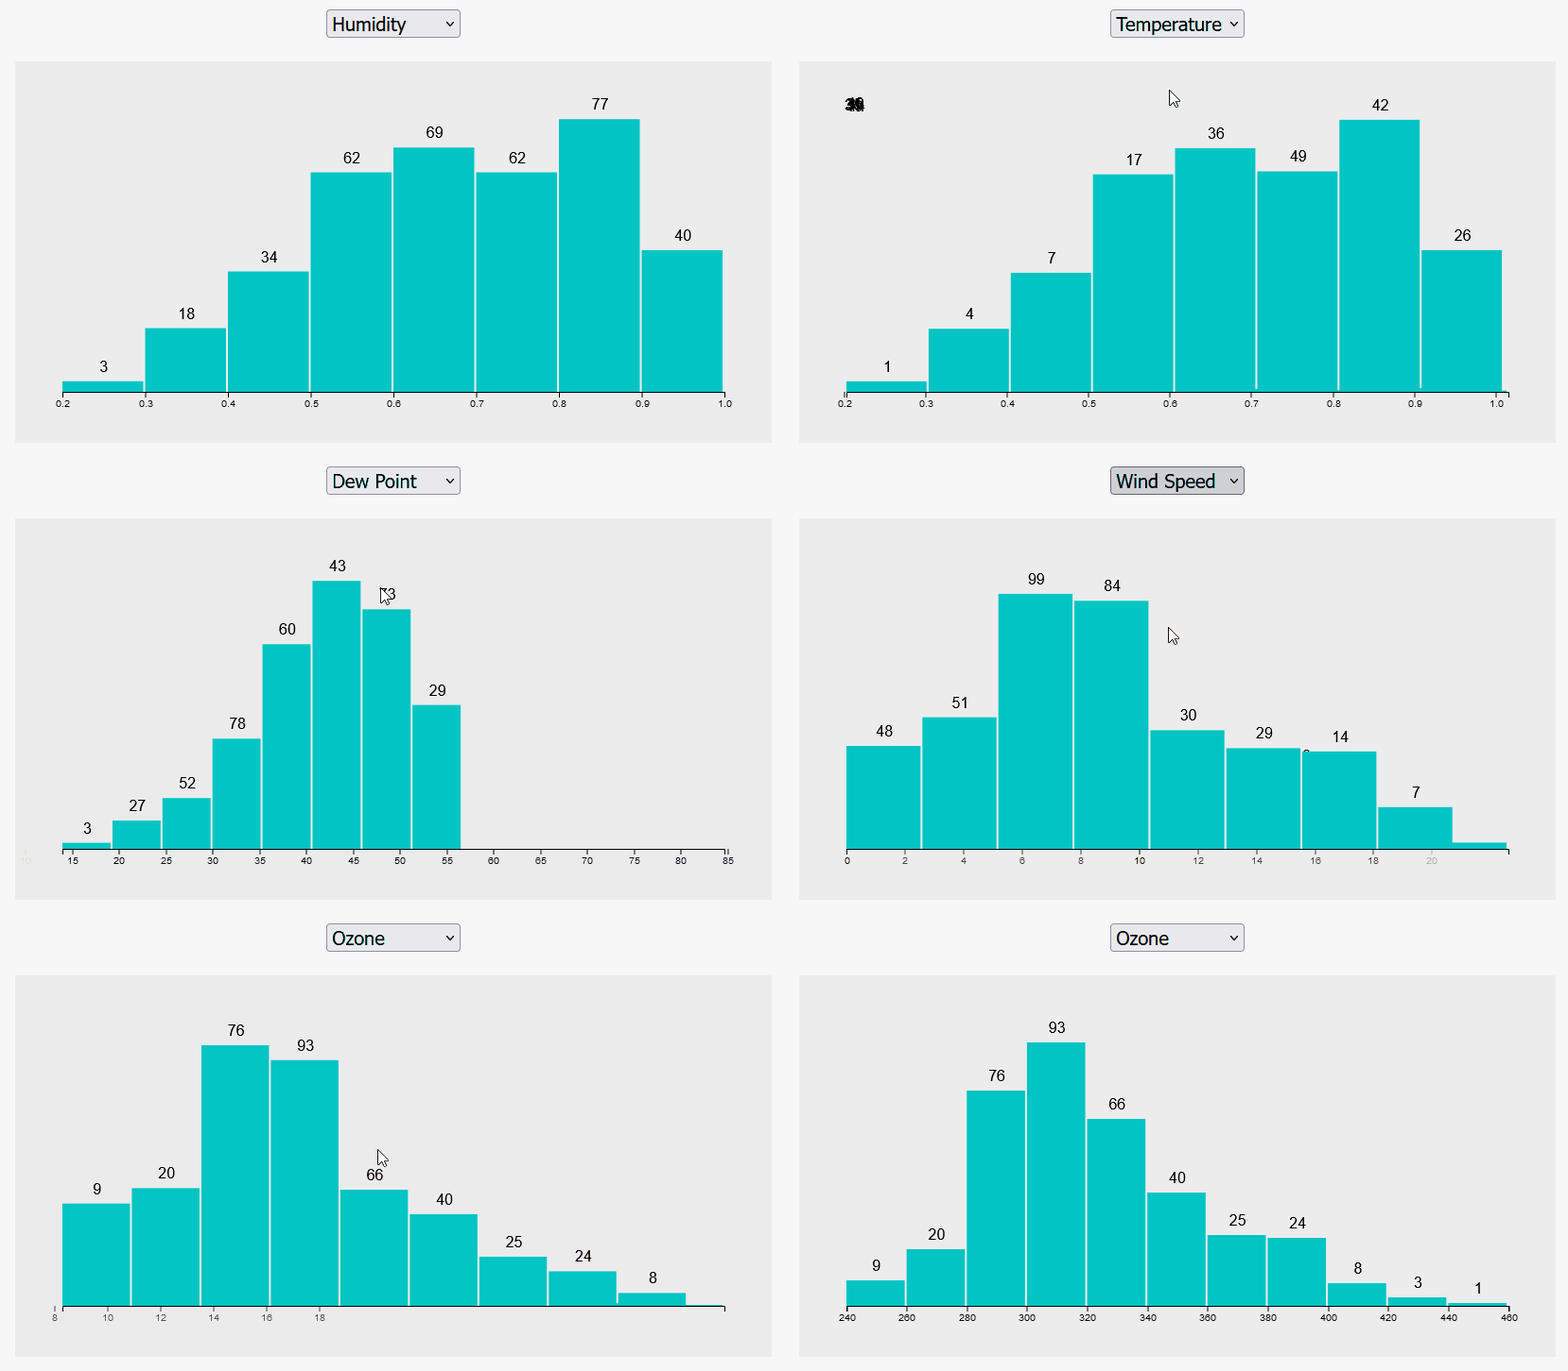
Before we do that we can round out the bars animations by also adding an animation for bars that are being removed with the _exit selection.
// Draw Bars
barsGroup
    .selectAll("rect")
    .data(binnedDataset)
    .join(
    (enter) =>
        enter
        .append("rect")
        .attr(
            "width",
            (d) => d3.max([0, xScale(d.x1) - xScale(d.x0)]) - binPadding
        )
        .attr("height", 0)
        .attr("x", (d) => xScale(d.x0))
        .attr("y", dimensions.containerHeight)
        .attr("fill", "#01c5c4"),
    (update) => update,
    (exit) =>
        exit
        .transition()
        .attr("y", dimensions.containerHeight)
        .attr("height", 0)
        .remove()
    )
    .transition()
    //.attr('width', ((dimensions.containerWidth / binnedDataset.length) - binPadding))
    .attr(
    "width",
    (d) => d3.max([0, xScale(d.x1) - xScale(d.x0)]) - binPadding
    )
    .attr("height", (d) => dimensions.containerHeight - yScale(yAccessor(d)))
    .attr("x", (d) => xScale(d.x0))
    .attr("y", (d) => yScale(yAccessor(d)))
    .attr("fill", "#01c5c4");
Transition Chaining
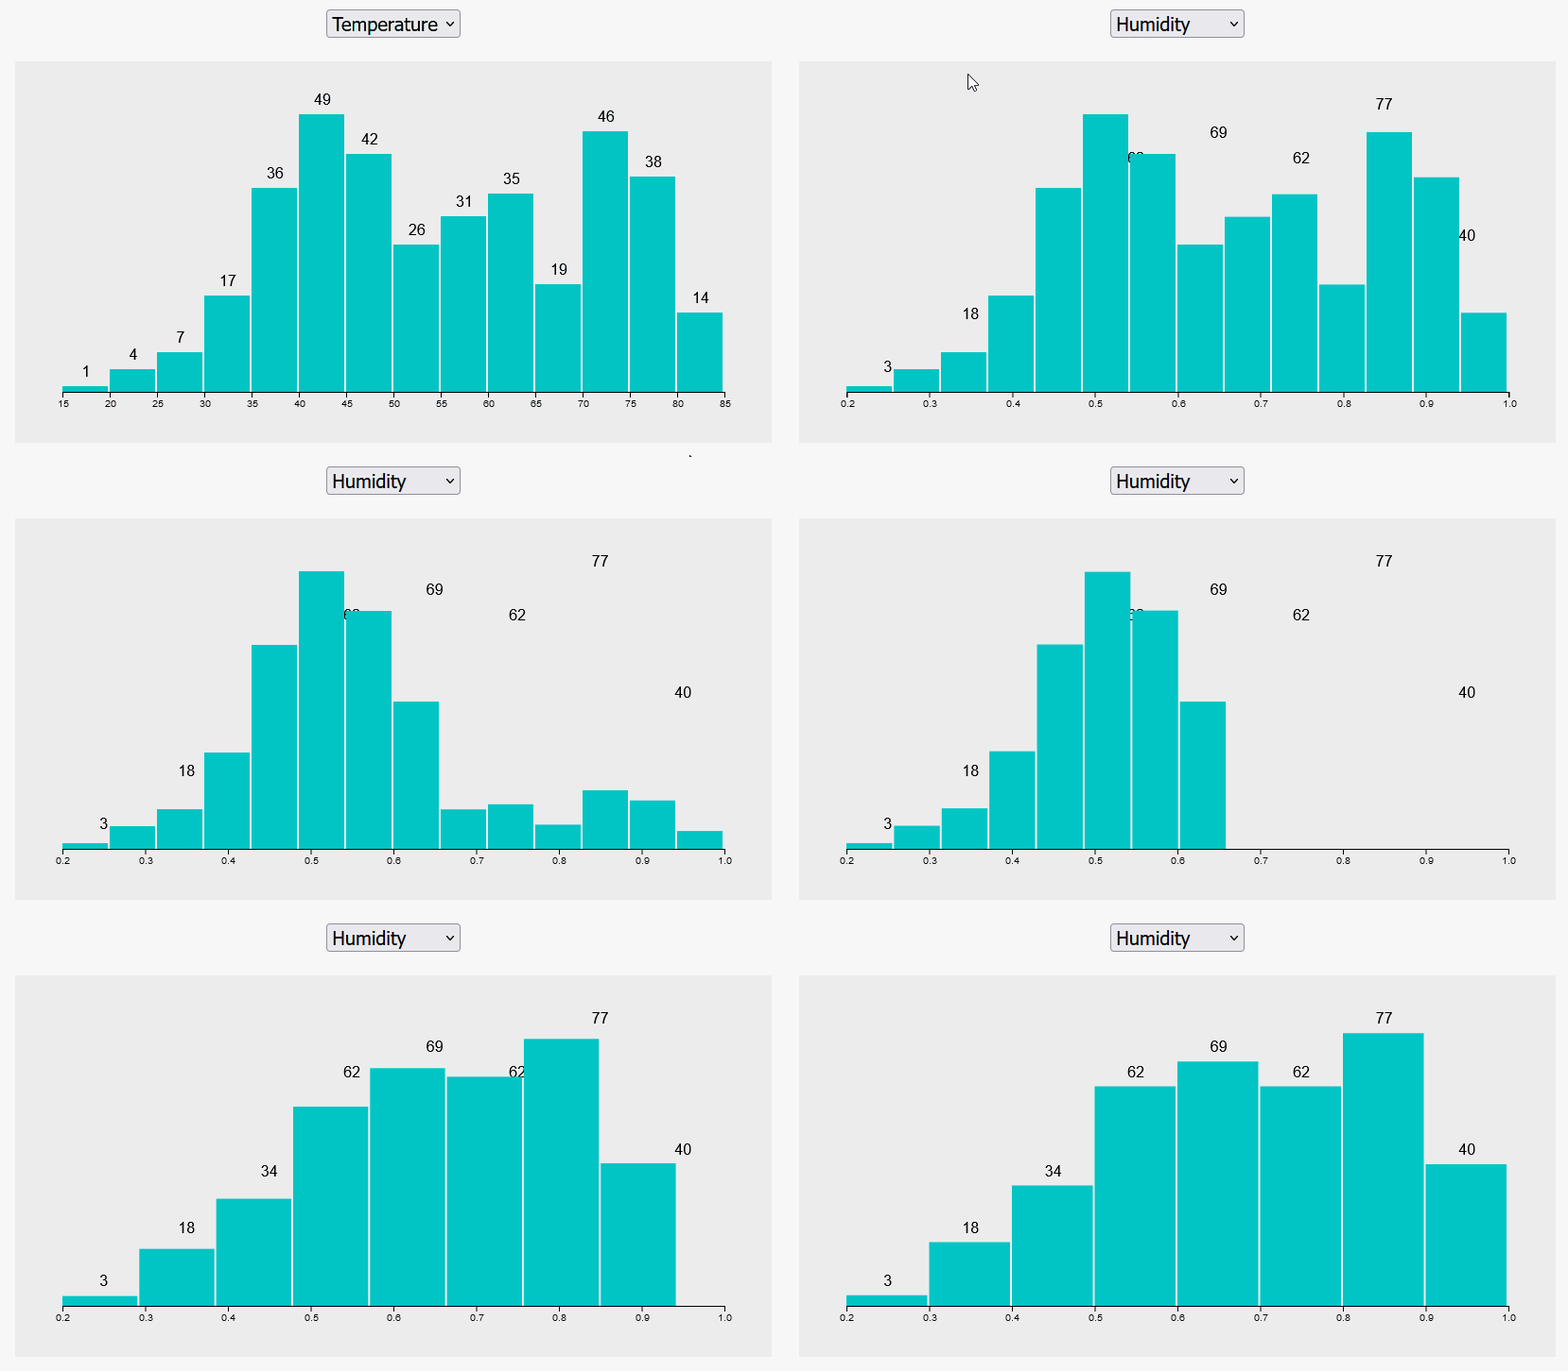
One of the other issues that is happing with our bars animation right now is that all the animations are happening at the same time. This results in the bars overlapping for a short period of time. We can avoid this by using transition chaining.
Essentially what we do is we take our transitions and assign them to variables, thus giving them an id. Then when we can chain one transition inside the definition of another transition, and D3 know that we want to wait for that transition to finish before we move on to the next one.
// Transitions
const exitTransition = d3.transition().duration(500)
const updateTransition = exitTransition.transition().duration(500)

// Draw Bars
barsGroup
    .selectAll("rect")
    .data(binnedDataset)
    .join(
    (enter) =>
        enter
        .append("rect")
        .attr(
            "width",
            (d) => d3.max([0, xScale(d.x1) - xScale(d.x0)]) - binPadding
        )
        .attr("height", 0)
        .attr("x", (d) => xScale(d.x0))
        .attr("y", dimensions.containerHeight)
        .attr("fill", "#01c5c4"),
    (update) => update,
    (exit) =>
        exit
        .transition(exitTransition) // highlight-line
        .attr("y", dimensions.containerHeight)
        .attr("height", 0)
        .remove()
    )
    .transition(updateTransition) // highlight-line
    //.attr('width', ((dimensions.containerWidth / binnedDataset.length) - binPadding))
    .attr(
    "width",
    (d) => d3.max([0, xScale(d.x1) - xScale(d.x0)]) - binPadding
    )
    .attr("height", (d) => dimensions.containerHeight - yScale(yAccessor(d)))
    .attr("x", (d) => xScale(d.x0))
    .attr("y", (d) => yScale(yAccessor(d)))
    .attr("fill", "#01c5c4");
Transition Colors
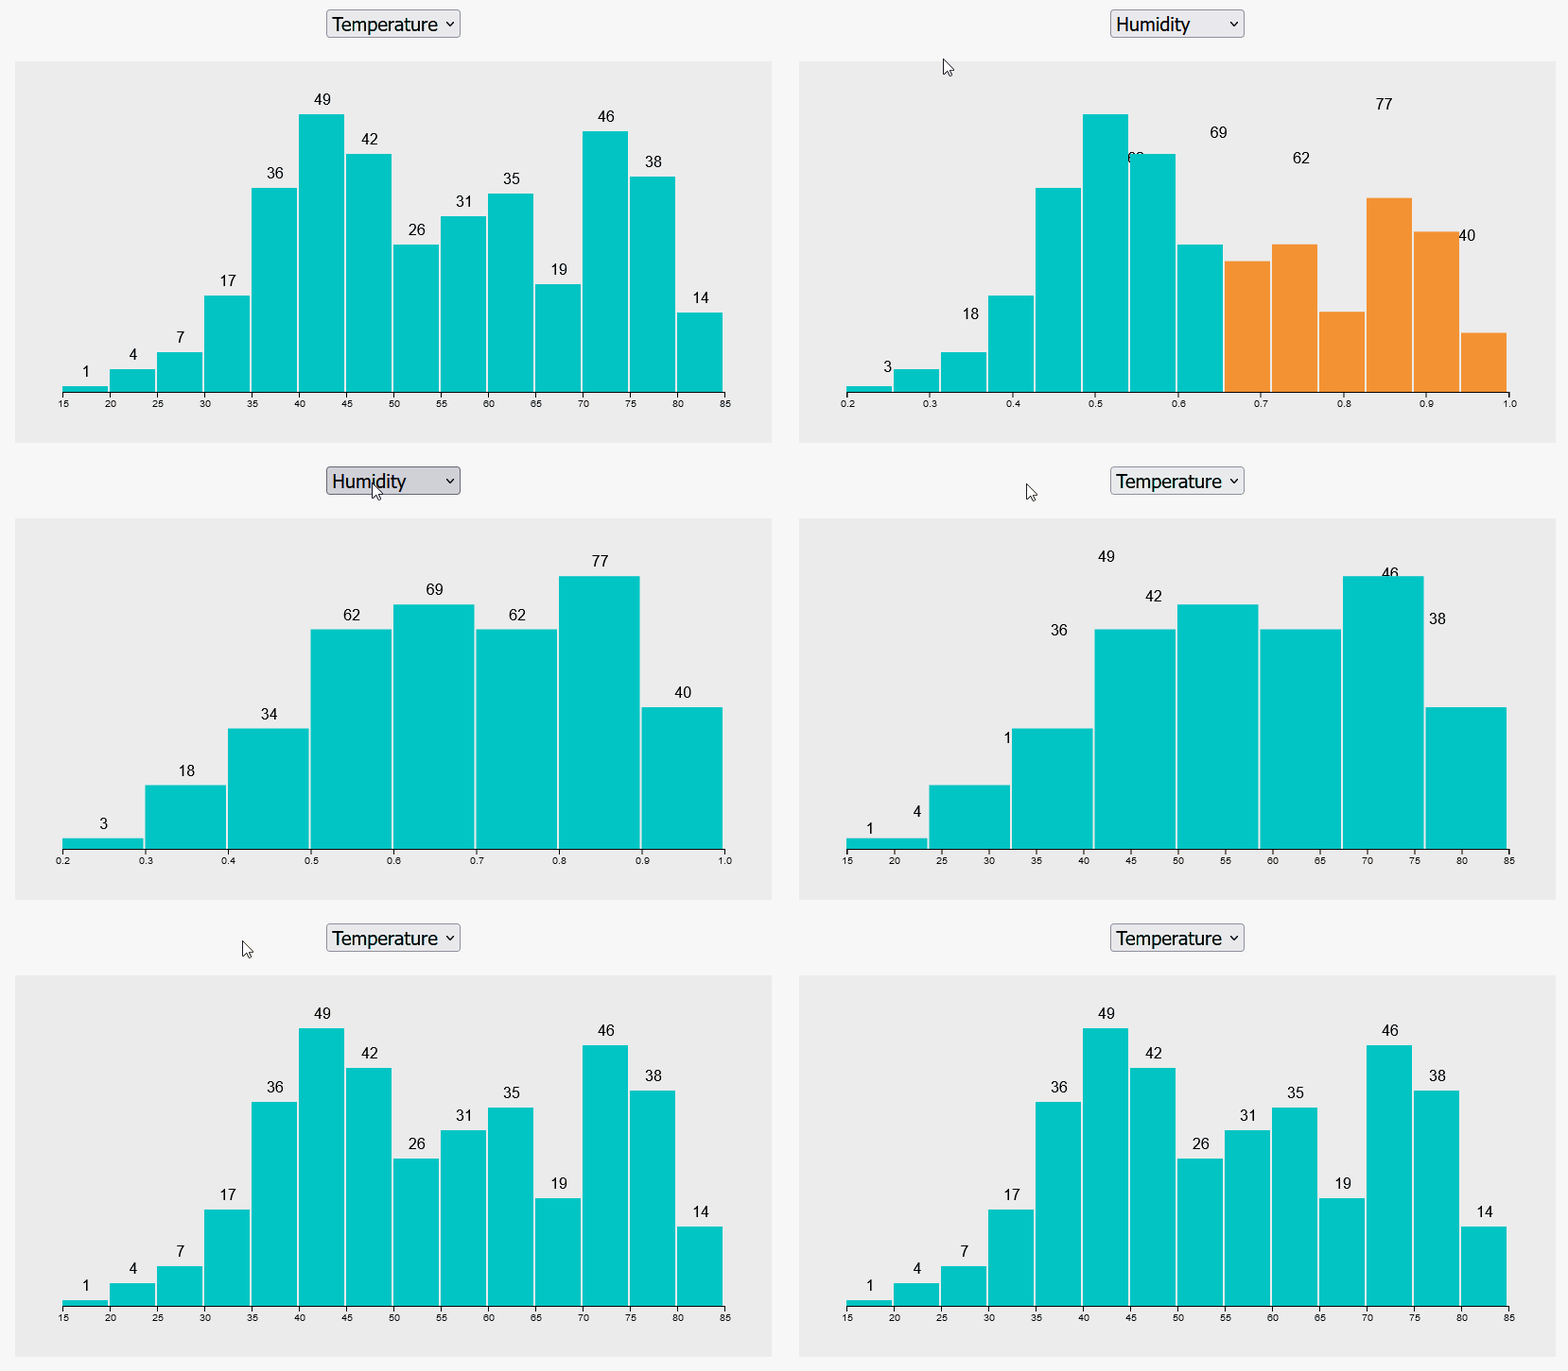
Using the _enter and _exit state we can change the colors of elements that are being added and taken away.
// Transitions
const exitTransition = d3.transition().duration(1000);
const updateTransition = exitTransition.transition().duration(1000);

// Draw Bars
barsGroup
    .selectAll("rect")
    .data(binnedDataset)
    .join(
    (enter) =>
        enter
        .append("rect")

        .attr(
            "width",
            (d) => d3.max([0, xScale(d.x1) - xScale(d.x0)]) - binPadding
        )
        .attr("height", 0)
        .attr("x", (d) => xScale(d.x0))
        .attr("y", dimensions.containerHeight)
        .attr("fill", "#b8de6f"), // highlight-line
    (update) => update,
    (exit) =>
        exit
        .attr("fill", "#f39233") // highlight-line
        .transition(exitTransition)
        .attr("y", dimensions.containerHeight)
        .attr("height", 0)
        .remove()
    )
    .transition(updateTransition)
    //.attr('width', ((dimensions.containerWidth / binnedDataset.length) - binPadding))
    .attr(
    "width",
    (d) => d3.max([0, xScale(d.x1) - xScale(d.x0)]) - binPadding
    )
    .attr("height", (d) => dimensions.containerHeight - yScale(yAccessor(d)))
    .attr("x", (d) => xScale(d.x0))
    .attr("y", (d) => yScale(yAccessor(d)))
    .attr("fill", "#01c5c4");
Transition Labels
Lastly we can add very similar transitions to our labels
// Transitions
    let transitionDuration = 1000;
    const exitTransition = d3.transition().duration(transitionDuration);
    const updateTransition = exitTransition
      .transition()
      .duration(transitionDuration);

    // Draw Bars
    barsGroup
      .selectAll("rect")
      .data(binnedDataset)
      .join(
        (enter) =>
          enter
            .append("rect")
            .attr(
              "width",
              (d) => d3.max([0, xScale(d.x1) - xScale(d.x0)]) - binPadding
            )
            .attr("height", 0)
            .attr("x", (d) => xScale(d.x0))
            .attr("y", dimensions.containerHeight)
            .attr("fill", "#b8de6f"),
        (update) => update,
        (exit) =>
          exit
            .attr("fill", "#f39233")
            .transition(exitTransition)
            .attr("y", dimensions.containerHeight)
            .attr("height", 0)
            .remove()
      )
      .transition(updateTransition)
      //.attr('width', ((dimensions.containerWidth / binnedDataset.length) - binPadding))
      .attr(
        "width",
        (d) => d3.max([0, xScale(d.x1) - xScale(d.x0)]) - binPadding
      )
      .attr("height", (d) => dimensions.containerHeight - yScale(yAccessor(d)))
      .attr("x", (d) => xScale(d.x0))
      .attr("y", (d) => yScale(yAccessor(d)))
      .attr("fill", "#01c5c4");

    // Bar Labels
    labelsGroup
      .selectAll("text")
      .data(binnedDataset)
      .join(
        (enter) =>
          enter
            .append("text")
            // add half the size of the bar to center the text
            .attr("x", (d) => xScale(d.x0) + (xScale(d.x1) - xScale(d.x0)) / 2)
            .attr("y", dimensions.containerHeight - 10)
            .text(yAccessor),
        (update) => update,
        (exit) =>
          exit
            .transition(exitTransition)
            .attr("y", dimensions.containerHeight)
            .attr("height", -10)
            .remove()
      )
      .transition(updateTransition)
      // add half the size of the bar to center the text
      .attr("x", (d) => xScale(d.x0) + (xScale(d.x1) - xScale(d.x0)) / 2)
      .attr("y", (d) => yScale(yAccessor(d)) - 10)
      .text(yAccessor);

Final Code
async function draw(el) {
  // Data
  const dataset = await d3.json("data.json");

  // Dimensions
  let dimensions = {
    width: 800,
    height: 400,
    margins: 50,
  };

  dimensions.containerWidth = dimensions.width - dimensions.margins * 2;
  dimensions.containerHeight = dimensions.height - dimensions.margins * 2;

  binPadding = 2;

  // Draw Image
  const svg = d3
    .select(el)
    .append("svg")
    .attr("width", dimensions.width)
    .attr("height", dimensions.height);

  const container = svg
    .append("g")
    .classed("container", true)
    .attr(
      "transform",
      `translate(${dimensions.margins}, ${dimensions.margins})`
    );

  // Element Groups
  const labelsGroup = container.append("g").classed("bar-labels", true);

  const xAxisGroup = container
    .append("g")
    .classed("axis", true)
    .style("transform", `translateY(${dimensions.containerHeight}px)`);

  const barsGroup = container.append("g").classed("bars", true);

  // Histogram Function
  // elements that rely on data go here
  function histogram(metric) {
    // Accessors
    const xAccessor = (d) => d.currently[metric];
    const yAccessor = (d) => d.length;

    // Scales
    const xScale = d3
      .scaleLinear()
      .domain(d3.extent(dataset, xAccessor))
      .range([0, dimensions.containerWidth])
      .nice();

    const bin = d3
      .bin()
      .domain(xScale.domain()) // data domain
      .value(xAccessor) // data values
      .thresholds(10); // number of buckets

    const binnedDataset = bin(dataset);
    console.log(binnedDataset);

    const yScale = d3
      .scaleLinear()
      .domain([0, d3.max(binnedDataset, yAccessor)])
      .range([dimensions.containerHeight, 0])
      .nice();

    // Transitions
    let transitionDuration = 1000;
    const exitTransition = d3.transition().duration(transitionDuration);
    const updateTransition = exitTransition
      .transition()
      .duration(transitionDuration);

    // Draw Bars
    barsGroup
      .selectAll("rect")
      .data(binnedDataset)
      .join(
        (enter) =>
          enter
            .append("rect")
            .attr(
              "width",
              (d) => d3.max([0, xScale(d.x1) - xScale(d.x0)]) - binPadding
            )
            .attr("height", 0)
            .attr("x", (d) => xScale(d.x0))
            .attr("y", dimensions.containerHeight)
            .attr("fill", "#b8de6f"),
        (update) => update,
        (exit) =>
          exit
            .attr("fill", "#f39233")
            .transition(exitTransition)
            .attr("y", dimensions.containerHeight)
            .attr("height", 0)
            .remove()
      )
      .transition(updateTransition)
      //.attr('width', ((dimensions.containerWidth / binnedDataset.length) - binPadding))
      .attr(
        "width",
        (d) => d3.max([0, xScale(d.x1) - xScale(d.x0)]) - binPadding
      )
      .attr("height", (d) => dimensions.containerHeight - yScale(yAccessor(d)))
      .attr("x", (d) => xScale(d.x0))
      .attr("y", (d) => yScale(yAccessor(d)))
      .attr("fill", "#01c5c4");

    // Bar Labels
    labelsGroup
      .selectAll("text")
      .data(binnedDataset)
      .join(
        (enter) =>
          enter
            .append("text")
            // add half the size of the bar to center the text
            .attr("x", (d) => xScale(d.x0) + (xScale(d.x1) - xScale(d.x0)) / 2)
            .attr("y", dimensions.containerHeight - 10)
            .text(yAccessor),
        (update) => update,
        (exit) =>
          exit
            .transition(exitTransition)
            .attr("y", dimensions.containerHeight)
            .attr("height", -10)
            .remove()
      )
      .transition(updateTransition)
      // add half the size of the bar to center the text
      .attr("x", (d) => xScale(d.x0) + (xScale(d.x1) - xScale(d.x0)) / 2)
      .attr("y", (d) => yScale(yAccessor(d)) - 10)
      .text(yAccessor);

    // Draw Axis
    const xAxis = d3.axisBottom(xScale);

    xAxisGroup.transition().call(xAxis);
  }

  // Select Handler
  d3.select("#metric").on("change", function (e) {
    e.preventDefault();

    histogram(this.value);
  });

  // default metric
  histogram("humidity");
}

draw("#chart");
Automated Amazon Reports
Automatically download Amazon Seller and Advertising reports to a private database. View beautiful, on demand, exportable performance reports.
