D3 Responsive Chart Scaffold
Intro
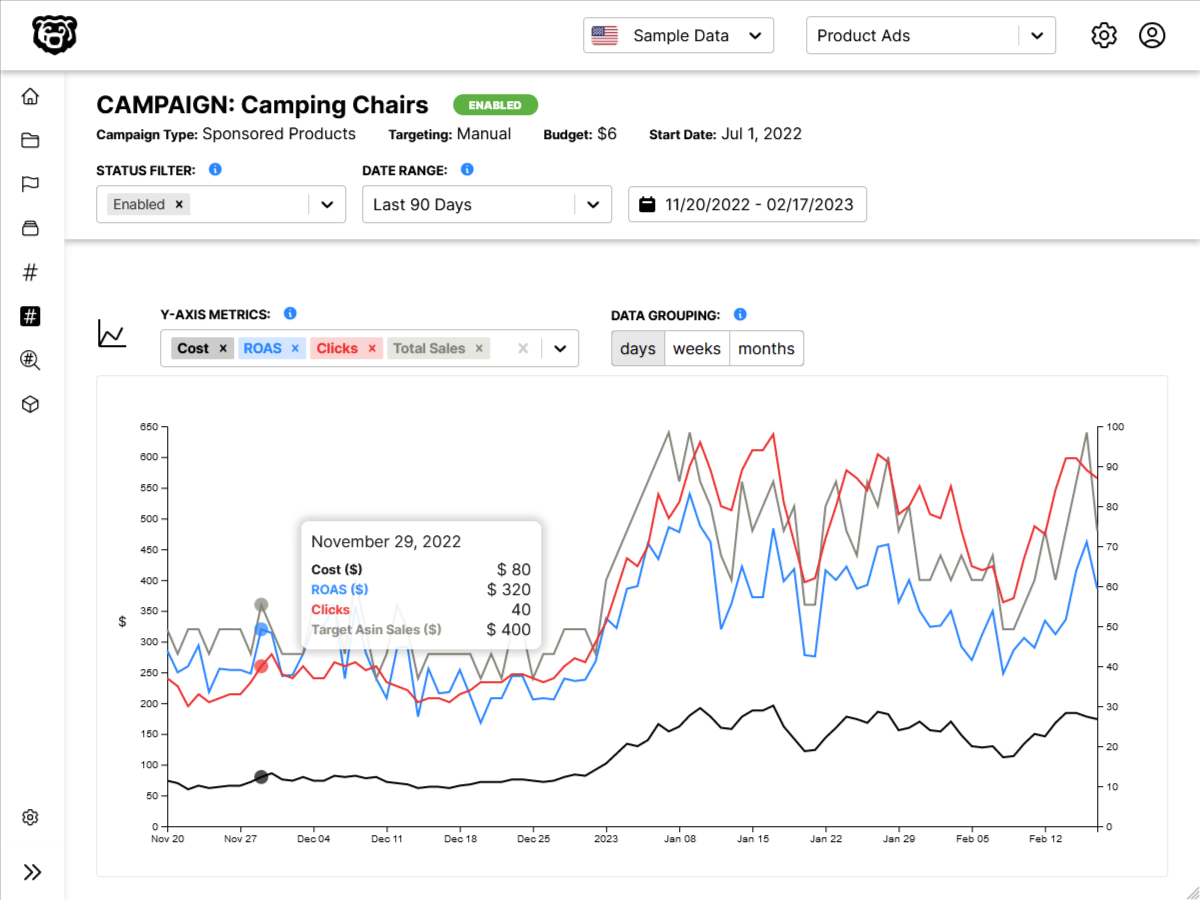
Here is a scaffold for a responsive D3 chart inside a React functional component. Includes scaffold for Redux. This structure should be chart agnostic, but detects and saves container dimensions in state and reloads chart when dimensions change.
Based on knowledge we put together in these posts:
Ncoughlin: D3 React Responsive Chart
CSS
Vital classes to fill available space and also make tooltips work if you are implementing them.
.chart-container {
  width: 100%;
}

.chart-svg-container {
  width: 100%;
  height: 800px;

  /* required for tooltip positioning */
  position: relative;
}
Component
This component detects the size of the container and feeds that into the chart dynamically as width and height. It automatically re-renders the chart if the dimensions change (window is resized) and clears all previous elements before re-drawing. See post above for more details on this method.
import React, { useRef, useEffect, useState } from "react";
// libraries
import * as d3 from "d3";
// redux
import { connect } from "react-redux";

const SomeChart = (props) => {
  // Element References
  const svgRef = useRef(null);
  const svgContainer = useRef(null); // The PARENT of the SVG

  // State to track width and height of SVG Container
  const [width, setWidth] = useState();
  const [height, setHeight] = useState();

  // calculate width and height of container
  const getSvgContainerSize = () => {
    const newWidth = svgContainer.current.clientWidth;
    setWidth(newWidth);

    const newHeight = svgContainer.current.clientHeight;
    setHeight(newHeight);
  };

  // resizer
  useEffect(() => {
    // get 'width' and 'height' on render
    getSvgContainerSize();
    // listen for resize changes
    window.addEventListener("resize", getSvgContainerSize);
    // cleanup event listener
    return () => window.removeEventListener("resize", getSvgContainerSize);
  }, []);

  // draw chart
  useEffect(() => {
    // D3 Code

    // Dimensions
    let dimensions = {
      width: width,
      height: height,
      margins: 50,
    };

    dimensions.containerWidth = dimensions.width - dimensions.margins * 2;
    dimensions.containerHeight = dimensions.height - dimensions.margins * 2;

    // selections
    const svg = d3
      .select(svgRef.current)
      .attr("width", dimensions.width)
      .attr("height", dimensions.height);

    // clear all previous content on refresh
    const everything = svg.selectAll("*");
    everything.remove();

    const container = svg
      .append("g")
      .attr(
        "transform",
        `translate(${dimensions.margins}, ${dimensions.margins})`
      );

    // rest of d3 code ...

    // const someElement = container.append('g')
    //  ...

  }, [width, height]); // redraw chart if data or dimensions change

  const renderContent = () => {
    return (
      <div className="chart-container">
        <div ref={svgContainer} className="chart-svg-container">
          <svg ref={svgRef} />
        </div>
      </div>
    );
  };

  return <>{renderContent()}</>;
};

// map state to props
function mapState(state) {
  return {};
}

// map actions to props
const mapDispatch = {};

// connect store
export default connect(mapState, mapDispatch)(SomeChart);
Automated Amazon Reports
Automatically download Amazon Seller and Advertising reports to a private database. View beautiful, on demand, exportable performance reports.