D3 Mean Line and Tooltip
Intro
Just adding a couple bells and whistles to our previous two D3 graphs.
Mean Line
async function draw(el) {
  // Data
  const dataset = await d3.json("data.json");

  // Dimensions
  let dimensions = {
    width: 800,
    height: 400,
    margins: 50,
  };

  dimensions.containerWidth = dimensions.width - dimensions.margins * 2;
  dimensions.containerHeight = dimensions.height - dimensions.margins * 2;

  binPadding = 2;

  // Draw Image
  const svg = d3
    .select(el)
    .append("svg")
    .attr("width", dimensions.width)
    .attr("height", dimensions.height);

  const container = svg
    .append("g")
    .classed("container", true)
    .attr(
      "transform",
      `translate(${dimensions.margins}, ${dimensions.margins})`
    );

  // Element Groups
  const labelsGroup = container.append("g").classed("bar-labels", true);

  const xAxisGroup = container
    .append("g")
    .classed("axis", true)
    .style("transform", `translateY(${dimensions.containerHeight}px)`);

  const barsGroup = container.append("g").classed("bars", true);
  const meanLine = container.append("line").classed("mean-line", true);

  // Histogram Function
  // elements that rely on data go here
  function histogram(metric) {
    // Accessors
    const xAccessor = (d) => d.currently[metric];
    const yAccessor = (d) => d.length;

    // Scales
    const xScale = d3
      .scaleLinear()
      .domain(d3.extent(dataset, xAccessor))
      .range([0, dimensions.containerWidth])
      .nice();

    const bin = d3
      .bin()
      .domain(xScale.domain()) // data domain
      .value(xAccessor) // data values
      .thresholds(10); // number of buckets

    const binnedDataset = bin(dataset);
    console.log(binnedDataset);

    const yScale = d3
      .scaleLinear()
      .domain([0, d3.max(binnedDataset, yAccessor)])
      .range([dimensions.containerHeight, 0])
      .nice();

    // Transitions
    let transitionDuration = 1000;
    const exitTransition = d3.transition().duration(transitionDuration);
    const updateTransition = exitTransition
      .transition()
      .duration(transitionDuration);

    // Draw Bars
    barsGroup
      .selectAll("rect")
      .data(binnedDataset)
      .join(
        (enter) =>
          enter
            .append("rect")
            .attr(
              "width",
              (d) => d3.max([0, xScale(d.x1) - xScale(d.x0)]) - binPadding
            )
            .attr("height", 0)
            .attr("x", (d) => xScale(d.x0))
            .attr("y", dimensions.containerHeight)
            .attr("fill", "#b8de6f"),
        (update) => update,
        (exit) =>
          exit
            .attr("fill", "#f39233")
            .transition(exitTransition)
            .attr("y", dimensions.containerHeight)
            .attr("height", 0)
            .remove()
      )
      .transition(updateTransition)
      //.attr('width', ((dimensions.containerWidth / binnedDataset.length) - binPadding))
      .attr(
        "width",
        (d) => d3.max([0, xScale(d.x1) - xScale(d.x0)]) - binPadding
      )
      .attr("height", (d) => dimensions.containerHeight - yScale(yAccessor(d)))
      .attr("x", (d) => xScale(d.x0))
      .attr("y", (d) => yScale(yAccessor(d)))
      .attr("fill", "#01c5c4");

    // Bar Labels
    labelsGroup
      .selectAll("text")
      .data(binnedDataset)
      .join(
        (enter) =>
          enter
            .append("text")
            // add half the size of the bar to center the text
            .attr("x", (d) => xScale(d.x0) + (xScale(d.x1) - xScale(d.x0)) / 2)
            .attr("y", dimensions.containerHeight - 10)
            .text(yAccessor),
        (update) => update,
        (exit) =>
          exit
            .transition(exitTransition)
            .attr("y", dimensions.containerHeight)
            .attr("height", -10)
            .remove()
      )
      .transition(updateTransition)
      // add half the size of the bar to center the text
      .attr("x", (d) => xScale(d.x0) + (xScale(d.x1) - xScale(d.x0)) / 2)
      .attr("y", (d) => yScale(yAccessor(d)) - 10)
      .text(yAccessor);

    // calculate mean
    const mean = d3.mean(dataset, xAccessor);

    meanLine
      .raise()
      .transition(updateTransition)
      .attr("x1", xScale(mean))
      .attr("y1", 0)
      .attr("x2", xScale(mean))
      .attr("y2", dimensions.containerHeight);

    // Draw Axis
    const xAxis = d3.axisBottom(xScale);

    xAxisGroup.transition().call(xAxis);
  }

  // Select Handler
  d3.select("#metric").on("change", function (e) {
    e.preventDefault();

    histogram(this.value);
  });

  // default metric
  histogram("humidity");
}

draw("#chart");
Tooltip
Although we could accomplish a tooltip with SVG, because it is such a simple item (a box with text inside) it is more common to accomplish this with html.
Scaffold Tooltip
Given the following HTML and CSS
<body>
    <div id="chart">
        <div id="tooltip">
        <div class="metric-date"></div>
        <div class="metric-humidity">
            Humidity: <span></span>
        </div>
        <div class="metric-temp">
            Temperature: <span></span>
        </div>
        </div>
    </div>
    <script src="https://d3js.org/d3.v6.min.js"></script>
    <script src="app.js"></script>
</body>
#chart{
  margin: 25px auto;
  width: 1000px;
  position: relative; // highlight-line
  background-color: rgb(240, 240, 240);
}

#tooltip {
  text-align: center;
  border: 1px solid #ccc;
  position: absolute; // highlight-line
  padding: 10px;
  background-color: #fff;
  display: none; // highlight-line
}

#tooltip .metric-date {
  text-decoration: underline;
}
Mouse Events
We can start by a mouse event to our data points
async function draw() {
// Data
const dataset = await d3.json("data.json");
const xAccessor = (d) => d.currently.humidity;
const yAccessor = (d) => d.currently.apparentTemperature;
// Dimensions
let dimensions = {
width: 800,
height: 800,
margin: {
top: 50,
bottom: 50,
left: 50,
right: 50,
},
};
dimensions.containerWidth = dimensions.width - dimensions.margin.left - dimensions.margin.right
dimensions.containerHeight = dimensions.height - dimensions.margin.top - dimensions.margin.bottom
// Draw Image
const svg = d3
.select("#chart")
.append("svg")
.attr("width", dimensions.width)
.attr("height", dimensions.height);
// Create Container
const container = svg
.append("g")
.classed("container", true)
.attr(
"transform",
`translate(${dimensions.margin.left}, ${dimensions.margin.top})`
);
// Scales
const xScale = d3.scaleLinear()
.domain(d3.extent(dataset, xAccessor))
.rangeRound([0, dimensions.containerWidth])
.clamp(true)
const yScale = d3.scaleLinear()
.domain(d3.extent(dataset, yAccessor))
.rangeRound([dimensions.containerHeight, 0])
.nice()
.clamp(true)
// Draw Circles
container
.append('g')
.classed('circles', true)
.selectAll("circle")
.data(dataset)
.join("circle")
.attr("r", 5)
.attr("fill", "rgba(0, 107, 239, 0.63)")
.attr("cx", d => xScale(xAccessor(d)))
.attr("cy", d => yScale(yAccessor(d)))
.attr('temp', yAccessor)
// no arrow function, we need "this" keyword
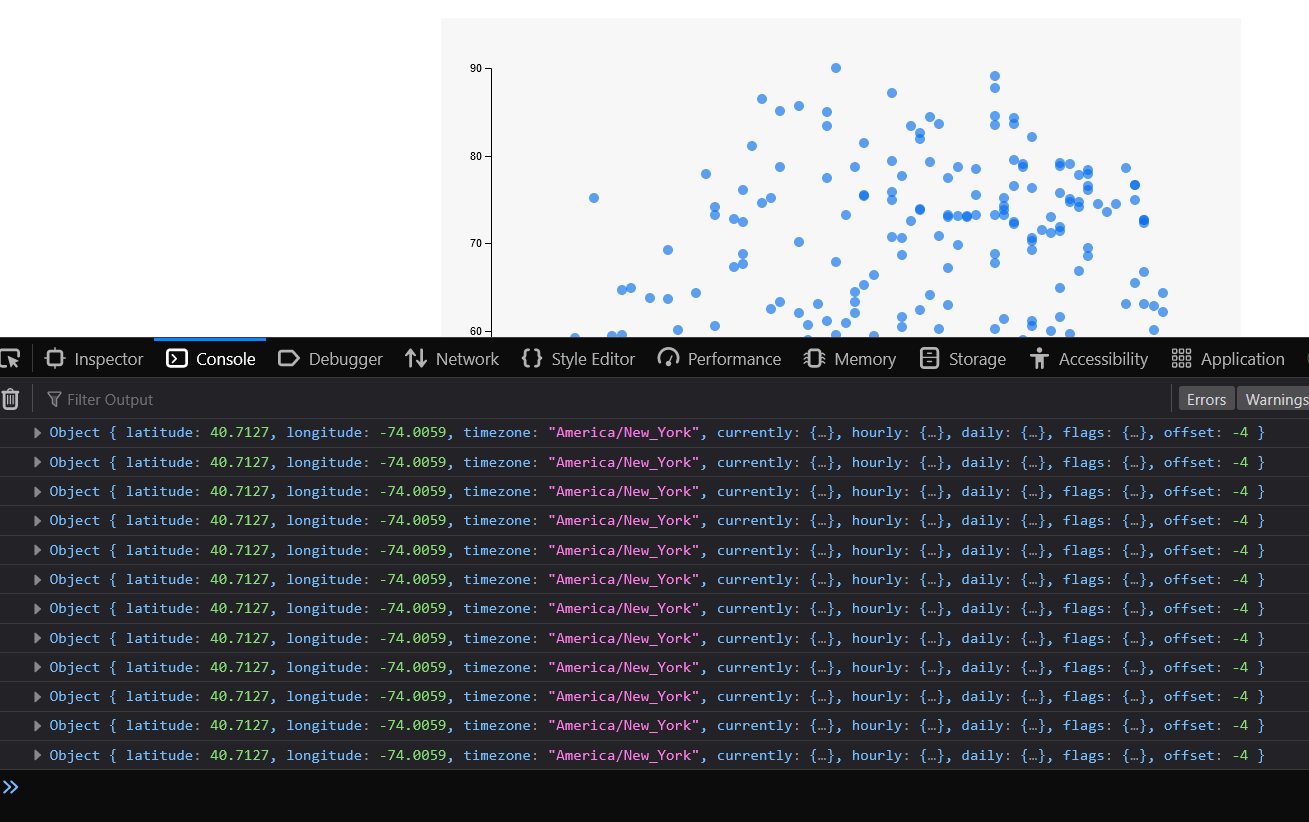
.on('mouseenter', function(event, datum){
console.log(datum);
})
// Axes
const xAxis = d3.axisBottom(xScale)
.tickFormat(d => d * 100 + "%")
const xAxisGroup = container
.append('g')
.call(xAxis)
.style('transform', `translateY(${dimensions.containerHeight}px)`)
.classed('axis', true)
xAxisGroup.append('text')
.attr('x', dimensions.containerWidth / 2)
.attr('y', dimensions.margin.bottom -10)
.attr('fill', 'black')
.text('Humidity')
const yAxis = d3.axisLeft(yScale)
const yAxisGroup = container
.append('g')
.call(yAxis)
.classed('axis', true)
yAxisGroup.append('text')
.attr('x', -dimensions.containerHeight / 2)
.attr('y', -dimensions.margin.left + 15)
.attr('fill', 'black')
.html('Temperature ° F')
.style('transform', 'rotate(270deg)')
.style('text-anchor', 'middle')
}
draw();
We have a simple console log in our mouseover event, so we should see the information about each dot as we mouseover it, and we do.
Now let's make the tooltip appear and disappear with our mouse events.
async function draw() {
  // Data
  const dataset = await d3.json("data.json");

  const xAccessor = (d) => d.currently.humidity;
  const yAccessor = (d) => d.currently.apparentTemperature;

  // Dimensions
  let dimensions = {
    width: 800,
    height: 800,
    margin: {
      top: 50,
      bottom: 50,
      left: 50,
      right: 50,
    },

  };

  dimensions.containerWidth = dimensions.width - dimensions.margin.left - dimensions.margin.right
  dimensions.containerHeight = dimensions.height - dimensions.margin.top - dimensions.margin.bottom

  // Draw Image
  const svg = d3
    .select("#chart")
    .append("svg")
    .attr("width", dimensions.width)
    .attr("height", dimensions.height);

  // Create Container
  const container = svg
    .append("g")
    .classed("container", true)
    .attr(
      "transform",
      `translate(${dimensions.margin.left}, ${dimensions.margin.top})`
    );

  const tooltip = d3.select('#tooltip')  // highlight-line

  // Scales
  const xScale = d3.scaleLinear()
    .domain(d3.extent(dataset, xAccessor))
    .rangeRound([0, dimensions.containerWidth])
    .clamp(true)

  const yScale = d3.scaleLinear()
    .domain(d3.extent(dataset, yAccessor))
    .rangeRound([dimensions.containerHeight, 0])
    .nice()
    .clamp(true)

  // Draw Circles
  container
    .append('g')
    .classed('circles', true)
    .selectAll("circle")
    .data(dataset)
    .join("circle")
    .attr("r", 5)
    .attr("fill", "rgba(0, 107, 239, 0.63)")
    .attr("cx", d => xScale(xAccessor(d)))
    .attr("cy", d => yScale(yAccessor(d)))
    .attr('temp', yAccessor)
    // no arrow function, we need "this" keyword
    .on('mouseenter', function(event, d){
      d3.select(this)
        .transition()
        .attr('fill', 'rgba(0, 107, 239, 1)')
        .attr('r', 8)
      tooltip
        .style('top', `${yScale(yAccessor(d)) - 25}px`)
        .style('left', `${xScale(xAccessor(d))}px`)
        .style('display', 'block')
    })
    .on('mouseleave', function(event, d){
      d3.select(this)
        .transition()
        .attr('fill', 'rgba(0, 107, 239, 0.63)')
        .attr('r', 5)
      tooltip
        .style('display', 'none')
    })

  // Axes
  const xAxis = d3.axisBottom(xScale)
    .tickFormat(d => d * 100 + "%")


  const xAxisGroup = container
    .append('g')
    .call(xAxis)
    .style('transform', `translateY(${dimensions.containerHeight}px)`)
    .classed('axis', true)

  xAxisGroup.append('text')
    .attr('x', dimensions.containerWidth / 2)
    .attr('y', dimensions.margin.bottom -10)
    .attr('fill', 'black')
    .text('Humidity')

  const yAxis = d3.axisLeft(yScale)

  const yAxisGroup = container
  .append('g')
  .call(yAxis)
  .classed('axis', true)

  yAxisGroup.append('text')
  .attr('x', -dimensions.containerHeight / 2)
  .attr('y', -dimensions.margin.left + 15)
  .attr('fill', 'black')
  .html('Temperature ° F')
  .style('transform', 'rotate(270deg)')
  .style('text-anchor', 'middle')
}

draw();
⚠️ Tooltip flickering error: If you are having an error where your tooltip is flickering (the mouse enter and exit listeners are firing rapidly) you probably are experiencing an issue where the tooltip is appearing below the mouse, causing the mouseleave event to fire and then immediately fire the mouseenter event over and over. The way to fix this is to position the tooltip further away from the data point so that the mouse is not hovering over the tooltip. StackOverflow: Why is my tooltip flashing on and off?
Because the tooltip is an HTML element and we are changing it's display properly, we cannot easily apply transitions to it as well, but the dots look nice and the tooltip is showing and hiding as it should. However the tooltip is still not populating with the data.
To fix this let's make a few more references to parts of the tooltip and then populate the text with data.
async function draw() {
  // Data
  const dataset = await d3.json("data.json");

  const xAccessor = (d) => d.currently.humidity;
  const yAccessor = (d) => d.currently.apparentTemperature;

  // Dimensions
  let dimensions = {
    width: 800,
    height: 800,
    margin: {
      top: 50,
      bottom: 50,
      left: 50,
      right: 50,
    },

  };

  dimensions.containerWidth = dimensions.width - dimensions.margin.left - dimensions.margin.right
  dimensions.containerHeight = dimensions.height - dimensions.margin.top - dimensions.margin.bottom

  // Draw Image
  const svg = d3
    .select("#chart")
    .append("svg")
    .attr("width", dimensions.width)
    .attr("height", dimensions.height);

  // Create Container
  const container = svg
    .append("g")
    .classed("container", true)
    .attr(
      "transform",
      `translate(${dimensions.margin.left}, ${dimensions.margin.top})`
    );

  const tooltip = d3.select('#tooltip')
  const tooltipDate = d3.select('.metric-date')
  const tooltipHumidity = d3.select('.metric-humidity span')
  const tooltipTemperature = d3.select('.metric-temp span')

  // Scales
  const xScale = d3.scaleLinear()
    .domain(d3.extent(dataset, xAccessor))
    .rangeRound([0, dimensions.containerWidth])
    .clamp(true)

  const yScale = d3.scaleLinear()
    .domain(d3.extent(dataset, yAccessor))
    .rangeRound([dimensions.containerHeight, 0])
    .nice()
    .clamp(true)

  // Draw Circles
  container
    .append('g')
    .classed('circles', true)
    .selectAll("circle")
    .data(dataset)
    .join("circle")
    .attr("r", 5)
    .attr("fill", "rgba(0, 107, 239, 0.63)")
    .attr("cx", d => xScale(xAccessor(d)))
    .attr("cy", d => yScale(yAccessor(d)))
    .attr('temp', yAccessor)
    // no arrow function, we need "this" keyword
    .on('mouseenter', function(event, d){
      d3.select(this)
        .transition()
        .attr('fill', 'rgba(0, 107, 239, 1)')
        .attr('r', 8)
      tooltip
        .style('top', `${yScale(yAccessor(d)) - 50}px`)
        .style('left', `${xScale(xAccessor(d))}px`)
        .style('display', 'block')
      tooltipDate
        .text(d.currently.time)
      tooltipHumidity
        .text(xAccessor(d))
      tooltipTemperature
        .text(yAccessor(d))
    })
    .on('mouseleave', function(event, d){
      d3.select(this)
        .transition()
        .attr('fill', 'rgba(0, 107, 239, 0.63)')
        .attr('r', 5)
      tooltip
        .style('display', 'none')
    })

  // Axes
  const xAxis = d3.axisBottom(xScale)
    .tickFormat(d => d * 100 + "%")


  const xAxisGroup = container
    .append('g')
    .call(xAxis)
    .style('transform', `translateY(${dimensions.containerHeight}px)`)
    .classed('axis', true)

  xAxisGroup.append('text')
    .attr('x', dimensions.containerWidth / 2)
    .attr('y', dimensions.margin.bottom -10)
    .attr('fill', 'black')
    .text('Humidity')

  const yAxis = d3.axisLeft(yScale)

  const yAxisGroup = container
  .append('g')
  .call(yAxis)
  .classed('axis', true)

  yAxisGroup.append('text')
  .attr('x', -dimensions.containerHeight / 2)
  .attr('y', -dimensions.margin.left + 15)
  .attr('fill', 'black')
  .html('Temperature ° F')
  .style('transform', 'rotate(270deg)')
  .style('text-anchor', 'middle')
}

draw();

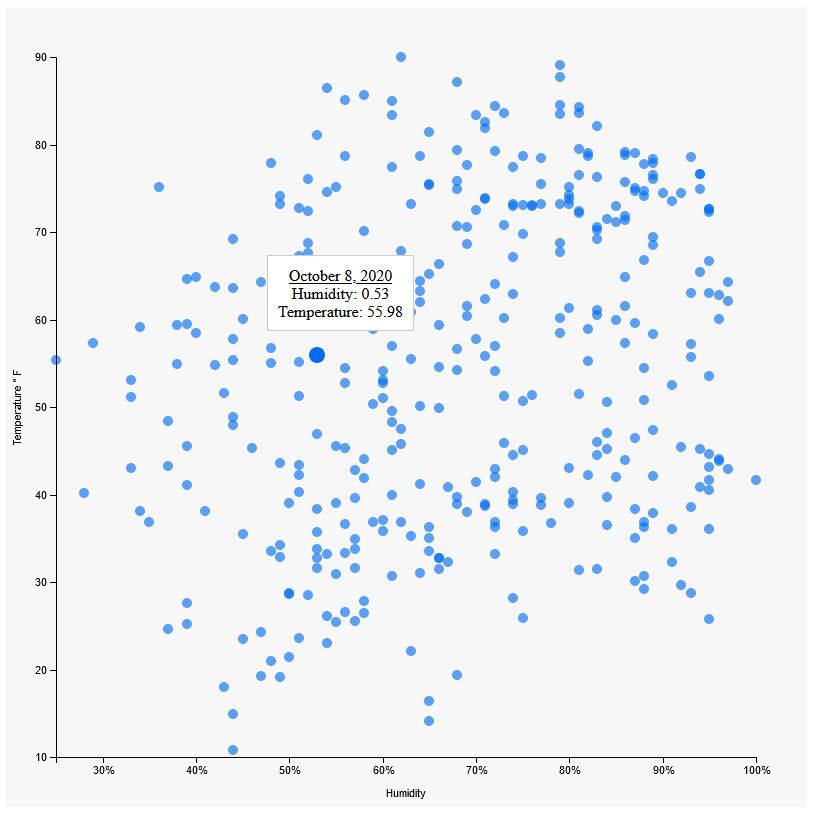
Formatter
D3 provides some helpful function to format our data, such as timestamps, or rounding decimals. The full syntax for these formatters is available in the documentation.
async function draw() {
  // Data
  const dataset = await d3.json("data.json");

  const xAccessor = (d) => d.currently.humidity;
  const yAccessor = (d) => d.currently.apparentTemperature;

  // Dimensions
  let dimensions = {
    width: 800,
    height: 800,
    margin: {
      top: 50,
      bottom: 50,
      left: 50,
      right: 50,
    },

  };

  dimensions.containerWidth = dimensions.width - dimensions.margin.left - dimensions.margin.right
  dimensions.containerHeight = dimensions.height - dimensions.margin.top - dimensions.margin.bottom

  // Draw Image
  const svg = d3
    .select("#chart")
    .append("svg")
    .attr("width", dimensions.width)
    .attr("height", dimensions.height);

  // Create Container
  const container = svg
    .append("g")
    .classed("container", true)
    .attr(
      "transform",
      `translate(${dimensions.margin.left}, ${dimensions.margin.top})`
    );

  // References
  const tooltip = d3.select('#tooltip')
  const tooltipDate = d3.select('.metric-date')
  const tooltipHumidity = d3.select('.metric-humidity span')
  const tooltipTemperature = d3.select('.metric-temp span')

  const formatter = d3.format('.2f')
  const dateFormatter = d3.timeFormat('%B %-d, %Y')

  // Scales
  const xScale = d3.scaleLinear()
    .domain(d3.extent(dataset, xAccessor))
    .rangeRound([0, dimensions.containerWidth])
    .clamp(true)

  const yScale = d3.scaleLinear()
    .domain(d3.extent(dataset, yAccessor))
    .rangeRound([dimensions.containerHeight, 0])
    .nice()
    .clamp(true)

  // Draw Circles
  container
    .append('g')
    .classed('circles', true)
    .selectAll("circle")
    .data(dataset)
    .join("circle")
    .attr("r", 5)
    .attr("fill", "rgba(0, 107, 239, 0.63)")
    .attr("cx", d => xScale(xAccessor(d)))
    .attr("cy", d => yScale(yAccessor(d)))
    .attr('temp', yAccessor)
    // no arrow function, we need "this" keyword
    .on('mouseenter', function(event, d){
      d3.select(this)
        .transition()
        .attr('fill', 'rgba(0, 107, 239, 1)')
        .attr('r', 8)
      tooltip
        .style('top', `${yScale(yAccessor(d)) - 50}px`)
        .style('left', `${xScale(xAccessor(d))}px`)
        .style('display', 'block')
      tooltipDate
        // multiply by 1000 to convert to ms
        .text(dateFormatter(d.currently.time*1000)) // highlight-line
      tooltipHumidity
        .text(formatter(xAccessor(d))) // highlight-line
      tooltipTemperature
        .text(formatter(yAccessor(d))) // highlight-line
    })
    .on('mouseleave', function(event, d){
      d3.select(this)
        .transition()
        .attr('fill', 'rgba(0, 107, 239, 0.63)')
        .attr('r', 5)
      tooltip
        .style('display', 'none')
    })

  // Axes
  const xAxis = d3.axisBottom(xScale)
    .tickFormat(d => d * 100 + "%")


  const xAxisGroup = container
    .append('g')
    .call(xAxis)
    .style('transform', `translateY(${dimensions.containerHeight}px)`)
    .classed('axis', true)

  xAxisGroup.append('text')
    .attr('x', dimensions.containerWidth / 2)
    .attr('y', dimensions.margin.bottom -10)
    .attr('fill', 'black')
    .text('Humidity')

  const yAxis = d3.axisLeft(yScale)

  const yAxisGroup = container
  .append('g')
  .call(yAxis)
  .classed('axis', true)

  yAxisGroup.append('text')
  .attr('x', -dimensions.containerHeight / 2)
  .attr('y', -dimensions.margin.left + 15)
  .attr('fill', 'black')
  .html('Temperature ° F')
  .style('transform', 'rotate(270deg)')
  .style('text-anchor', 'middle')
}

draw();
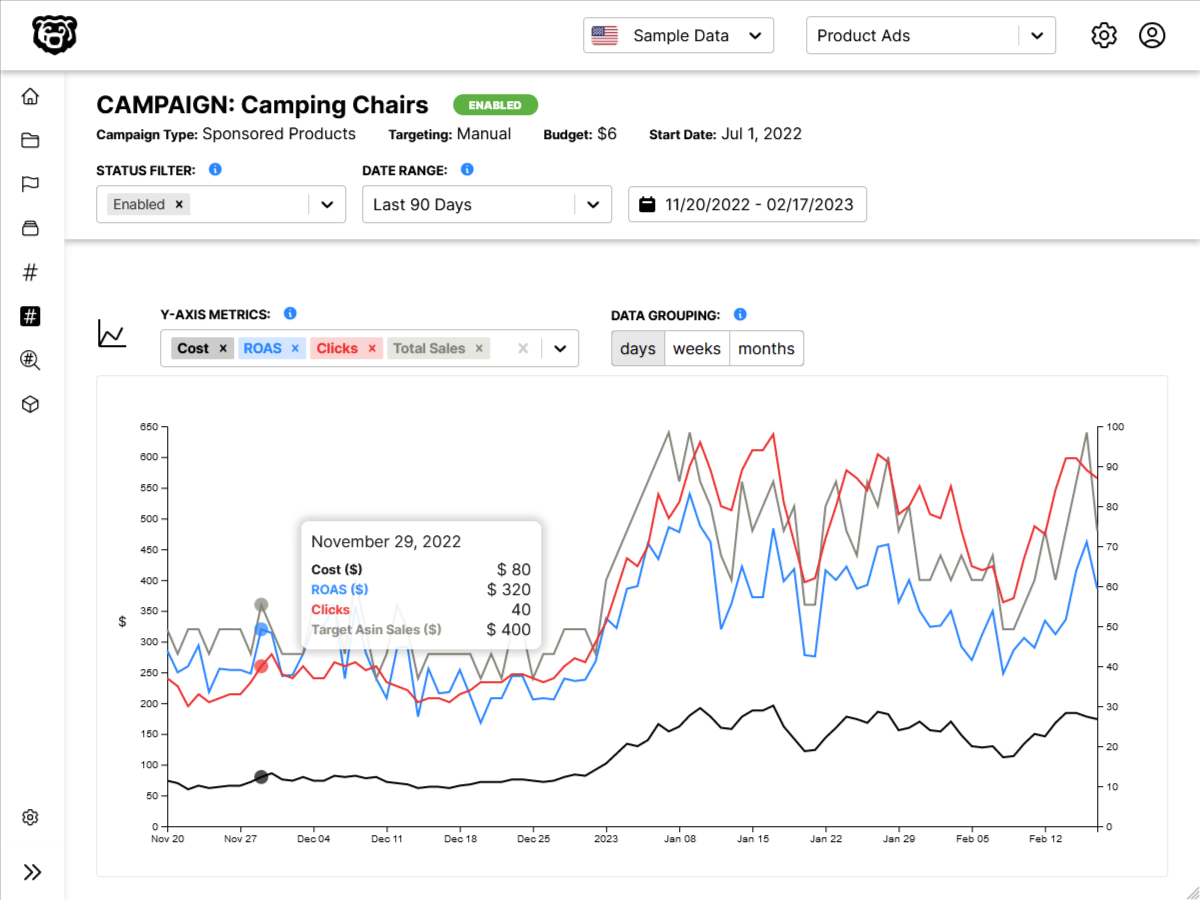
Automated Amazon Reports
Automatically download Amazon Seller and Advertising reports to a private database. View beautiful, on demand, exportable performance reports.