D3 Histogram with Variable Data
Intro
Histograms are a type of bar chart that group elements within the range into buckets and then show their frequency. We are going to be working with the same weather data that we used to make a scatterplot earlier. Then we are going to be adding some animations and interactivity to our chart.
Building the Histogram
Let's start with the basics, drawing the image, joining the data and creating an xScale to just get some rectangles on the page.
async function draw(el) {
  // Data
  const dataset = await d3.json('data.json')

  const xAccessor = d => d.currently.humidity

  // Dimensions
  let dimensions = {
    width: 800,
    height: 400,
    margins: 50
  };

  dimensions.containerWidth = dimensions.width - dimensions.margins * 2
  dimensions.containerHeight = dimensions.height - dimensions.margins * 2

  // Draw Image
  const svg = d3.select(el)
    .append("svg")
    .attr("width", dimensions.width)
    .attr("height", dimensions.height)

  const container = svg.append("g")
    .classed("container", true)
    .attr(
      "transform",
      `translate(${dimensions.margins}, ${dimensions.margins})`
    )

  // Scales
  const xScale = d3.scaleLinear()
  .domain(d3.extent(dataset, xAccessor))
  .range([0, dimensions.containerWidth])
  .nice()

  // Draw Bars
  container.selectAll('rect')
    .data(dataset)
    .join('rect')
    .attr('width', 5)
    .attr('height', 100)
    .attr('x', d=> xScale(xAccessor(d)))
    .attr('y', 0)
}

draw("#chart")

We haven't yet grouped our data into buckets, or dealt with the y-axis at all.
.bin
The D3 bin function is our method to group our data into buckets (or bins). Let's create a new function using this .bin method. The method requires that we pass in the domain of the data. We could simply repeat the .extent method that we used in the xScale
// Scales
  const xScale = d3.scaleLinear()
    .domain(d3.extent(dataset, xAccessor)) // highlight-line
    .range([0, dimensions.containerWidth])
    .nice()

  const bin = d3.bin()
    .domain(d3.extent(dataset, xAccessor)) // highlight-line
However, since we have already calculated the domain, we can simply reference it from our xScale object
// Scales
  const xScale = d3.scaleLinear()
    .domain(d3.extent(dataset, xAccessor))
    .range([0, dimensions.containerWidth])
    .nice()

  const bin = d3.bin()
    .domain(xScale.domain()) // highlight-line
and then we can feed in the other arguments that .bin requires and set our new dataset to a variable.
const bin = d3.bin()
  .domain(xScale.domain()) // data domain
  .value(xAccessor) // data values
  .thresholds(10) // number of buckets

const binnedDataset = bin(dataset)
If we log the binnedDataset we can see the following
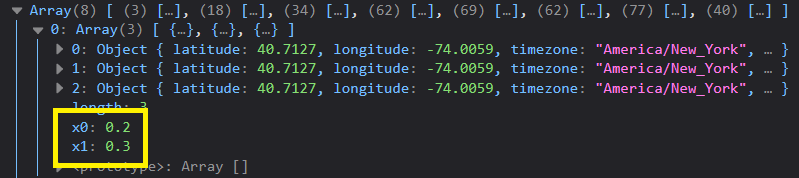
We have these new x0 and x1 values. These represent the start and end of the bin relative to the data, which is humidity on a scale of 0-1. Remember that these data min and max values for each bucket are available.
Dynamic Width
In most histograms all the bars are of equal width, which means we could set the width of each bar with something simple like this.
  // Draw Bars
  container.selectAll('rect')
    .data(binnedDataset)
    .join('rect')
    .attr('width', ((dimensions.containerWidth / binnedDataset.length) - binPadding))
    .attr('height', 100)
    .attr('x', d=> xScale(d.x0))
    .attr('y', 0)
However if you wanted to set the width of each bar dynamically based on the bin data you could so something like this
  // Draw Bars
  container.selectAll('rect')
    .data(binnedDataset)
    .join('rect')
    .attr('width', d => d3.max([0, xScale(d.x1) - xScale(d.x0)]) - binPadding)
    .attr('height', 100)
    .attr('x', d=> xScale(d.x0))
    .attr('y', 0)
In this case the bins are all of equal size so it provides the same result.

yScale and Height
Our yScale and bar height will now be based on the binned dataset that we created. Remember that the actual values of the data don't matter, just the count in each bin.
async function draw(el) {
  // Data
  const dataset = await d3.json("data.json");

  const xAccessor = (d) => d.currently.humidity;
  // we only need the count here
  const yAccessor = (d) => d.length;  // highlight-line

  // Dimensions
  let dimensions = {
    width: 800,
    height: 400,
    margins: 50,
  };

  dimensions.containerWidth = dimensions.width - dimensions.margins * 2;
  dimensions.containerHeight = dimensions.height - dimensions.margins * 2;

  binPadding = 2;

  // Draw Image
  const svg = d3
    .select(el)
    .append("svg")
    .attr("width", dimensions.width)
    .attr("height", dimensions.height);

  const container = svg
    .append("g")
    .classed("container", true)
    .attr(
      "transform",
      `translate(${dimensions.margins}, ${dimensions.margins})`
    );

  // Scales
  const xScale = d3
    .scaleLinear()
    .domain(d3.extent(dataset, xAccessor))
    .range([0, dimensions.containerWidth])
    .nice();

  const bin = d3
    .bin()
    .domain(xScale.domain()) // data domain
    .value(xAccessor) // data values
    .thresholds(10); // number of buckets

  const binnedDataset = bin(dataset);
  console.log(binnedDataset);

  const yScale = d3
    .scaleLinear()
    .domain([0, d3.max(binnedDataset, yAccessor)])
    .range([dimensions.containerHeight, 0])
    .nice();

  // Draw Bars
  container
    .append('g')
    .classed("bars", true)
    .selectAll("rect")
    .data(binnedDataset)
    .join("rect")
    //.attr('width', ((dimensions.containerWidth / binnedDataset.length) - binPadding))
    .attr("width", (d) => d3.max([0, xScale(d.x1) - xScale(d.x0)]) - binPadding)
    .attr("height", (d) => dimensions.containerHeight - yScale(yAccessor(d)))
    .attr("x", (d) => xScale(d.x0))
    .attr("y", (d) => yScale(yAccessor(d)))
    .attr('fill', "rgb(165, 140, 95)")
}

draw("#chart");

X-Axis
// Draw Axis
const xAxis = d3.axisBottom(xScale)

const xAxisGroup = container.append('g')
  .style('transform', `translateY(${dimensions.containerHeight}px)`)

xAxisGroup.call(xAxis)

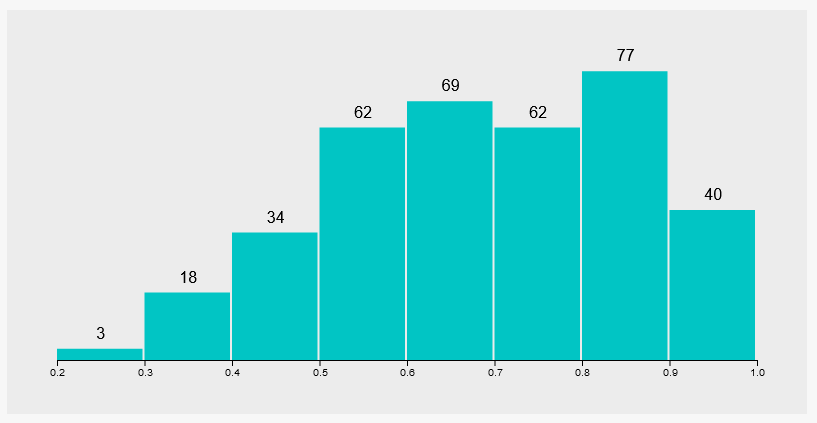
Bar Labels
async function draw(el) {
  // Data
  const dataset = await d3.json("data.json");

  const xAccessor = (d) => d.currently.humidity;
  // we only need the count here
  const yAccessor = (d) => d.length;

  // Dimensions
  let dimensions = {
    width: 800,
    height: 400,
    margins: 50,
  };

  dimensions.containerWidth = dimensions.width - dimensions.margins * 2;
  dimensions.containerHeight = dimensions.height - dimensions.margins * 2;

  binPadding = 2;

  // Draw Image
  const svg = d3
    .select(el)
    .append("svg")
    .attr("width", dimensions.width)
    .attr("height", dimensions.height);

  const container = svg
    .append("g")
    .classed("container", true)
    .attr(
      "transform",
      `translate(${dimensions.margins}, ${dimensions.margins})`
    );

  // Scales
  const xScale = d3
    .scaleLinear()
    .domain(d3.extent(dataset, xAccessor))
    .range([0, dimensions.containerWidth])
    .nice();

  const bin = d3
    .bin()
    .domain(xScale.domain()) // data domain
    .value(xAccessor) // data values
    .thresholds(10); // number of buckets

  const binnedDataset = bin(dataset);
  console.log(binnedDataset);

  const yScale = d3
    .scaleLinear()
    .domain([0, d3.max(binnedDataset, yAccessor)])
    .range([dimensions.containerHeight, 0])
    .nice();

  // Draw Bars
  container
    .append("g")
    .classed("bars", true)
    .selectAll("rect")
    .data(binnedDataset)
    .join("rect")
    //.attr('width', ((dimensions.containerWidth / binnedDataset.length) - binPadding))
    .attr("width", (d) => d3.max([0, xScale(d.x1) - xScale(d.x0)]) - binPadding)
    .attr("height", (d) => dimensions.containerHeight - yScale(yAccessor(d)))
    .attr("x", (d) => xScale(d.x0))
    .attr("y", (d) => yScale(yAccessor(d)))
    .attr("fill", "#01c5c4");

  // Bar Labels
  container
    .append("g")
    .classed("bar-labels", true)
    .selectAll("text")
    .data(binnedDataset)
    .join("text")
    // add half the size of the bar to center the text
    .attr("x", (d) => xScale(d.x0) + (xScale(d.x1) - xScale(d.x0)) / 2)
    .attr("y", (d) => yScale(yAccessor(d)) - 10)
    .text(yAccessor)

  // Draw Axis
  const xAxis = d3.axisBottom(xScale);

  const xAxisGroup = container
    .append("g")
    .style("transform", `translateY(${dimensions.containerHeight}px)`);

  xAxisGroup.call(xAxis);
}

draw("#chart");
Dynamic Data
Let's work on being able to change the data that the histogram shows using a dropdown.
We can start by adding a very simple dropdown to our html body.
<body>
  <select id="metric">
    <option value="humidity" selected>Humidity</option>
    <option value="temperature">Temperature</option>
    <option value="dewPoint">Dew Point</option>
    <option value="windSpeed">Wing Speed</option>
    <option value="cloudCover">Cloud Cover</option>
    <option value="ozone">Ozone</option>
  </select>

  <div id="chart"></div>

  <script src="https://d3js.org/d3.v6.min.js"></script>
  <script src="app.js"></script>
</body>
The option values match the keys in our data objects. Next we can create a new section at the end of our histogram. We want to place it at the bottom below all the visualization calls to make sure that everything renders before a re-render can be called.
async function draw(el) {
  // Data
  const dataset = await d3.json("data.json");

  const xAccessor = (d) => d.currently.humidity;
  // we only need the count here
  const yAccessor = (d) => d.length;

  // Dimensions
  let dimensions = {
    width: 800,
    height: 400,
    margins: 50,
  };

  dimensions.containerWidth = dimensions.width - dimensions.margins * 2;
  dimensions.containerHeight = dimensions.height - dimensions.margins * 2;

  binPadding = 2;

  // Draw Image
  const svg = d3
    .select(el)
    .append("svg")
    .attr("width", dimensions.width)
    .attr("height", dimensions.height);

  const container = svg
    .append("g")
    .classed("container", true)
    .attr(
      "transform",
      `translate(${dimensions.margins}, ${dimensions.margins})`
    );

  // Scales
  const xScale = d3
    .scaleLinear()
    .domain(d3.extent(dataset, xAccessor))
    .range([0, dimensions.containerWidth])
    .nice();

  const bin = d3
    .bin()
    .domain(xScale.domain()) // data domain
    .value(xAccessor) // data values
    .thresholds(10); // number of buckets

  const binnedDataset = bin(dataset);
  console.log(binnedDataset);

  const yScale = d3
    .scaleLinear()
    .domain([0, d3.max(binnedDataset, yAccessor)])
    .range([dimensions.containerHeight, 0])
    .nice();

  // Draw Bars
  container
    .append("g")
    .classed("bars", true)
    .selectAll("rect")
    .data(binnedDataset)
    .join("rect")
    //.attr('width', ((dimensions.containerWidth / binnedDataset.length) - binPadding))
    .attr("width", (d) => d3.max([0, xScale(d.x1) - xScale(d.x0)]) - binPadding)
    .attr("height", (d) => dimensions.containerHeight - yScale(yAccessor(d)))
    .attr("x", (d) => xScale(d.x0))
    .attr("y", (d) => yScale(yAccessor(d)))
    .attr("fill", "#01c5c4");

  // Bar Labels
  container
    .append("g")
    .classed("bar-labels", true)
    .selectAll("text")
    .data(binnedDataset)
    .join("text")
    // add half the size of the bar to center the text
    .attr("x", (d) => xScale(d.x0) + (xScale(d.x1) - xScale(d.x0)) / 2)
    .attr("y", (d) => yScale(yAccessor(d)) - 10)
    .text(yAccessor)

  // Draw Axis
  const xAxis = d3.axisBottom(xScale);

  const xAxisGroup = container
    .append("g")
    .style("transform", `translateY(${dimensions.containerHeight}px)`);

  xAxisGroup.call(xAxis);

  // Select Handler
  d3.select('#metric')
    .on('change', function (e) {
      e.preventDefault()

      console.log(this)
    })
}

draw("#chart");
And we can see that D3 has it's own event method, .on where we specify the type of change and then the callback function. We are just going to prevent the default behaviour and then log the action to start.

Let's make a new function that contains all the data specific code the histogram that takes the metric as an argument, and move all the metric reliant code into that. Then we can call that function inside our event handler.
async function draw(el) {
  // Data
  const dataset = await d3.json("data.json");

  // Dimensions
  let dimensions = {
    width: 800,
    height: 400,
    margins: 50,
  };

  dimensions.containerWidth = dimensions.width - dimensions.margins * 2;
  dimensions.containerHeight = dimensions.height - dimensions.margins * 2;

  binPadding = 2;

  // Draw Image
  const svg = d3
    .select(el)
    .append("svg")
    .attr("width", dimensions.width)
    .attr("height", dimensions.height);

  const container = svg
    .append("g")
    .classed("container", true)
    .attr(
      "transform",
      `translate(${dimensions.margins}, ${dimensions.margins})`
    );

  function histogram(metric) {
    // code that relies on data goes here

    // Accessors
    const xAccessor = (d) => d.currently[metric];
    const yAccessor = (d) => d.length;

    // Scales
    const xScale = d3
      .scaleLinear()
      .domain(d3.extent(dataset, xAccessor))
      .range([0, dimensions.containerWidth])
      .nice();

    const bin = d3
      .bin()
      .domain(xScale.domain()) // data domain
      .value(xAccessor) // data values
      .thresholds(10); // number of buckets

    const binnedDataset = bin(dataset);
    console.log(binnedDataset);

    const yScale = d3
      .scaleLinear()
      .domain([0, d3.max(binnedDataset, yAccessor)])
      .range([dimensions.containerHeight, 0])
      .nice();

    // Draw Bars
    container
      .append("g")
      .classed("bars", true)
      .selectAll("rect")
      .data(binnedDataset)
      .join("rect")
      //.attr('width', ((dimensions.containerWidth / binnedDataset.length) - binPadding))
      .attr(
        "width",
        (d) => d3.max([0, xScale(d.x1) - xScale(d.x0)]) - binPadding
      )
      .attr("height", (d) => dimensions.containerHeight - yScale(yAccessor(d)))
      .attr("x", (d) => xScale(d.x0))
      .attr("y", (d) => yScale(yAccessor(d)))
      .attr("fill", "#01c5c4");

    // Bar Labels
    container
      .append("g")
      .classed("bar-labels", true)
      .selectAll("text")
      .data(binnedDataset)
      .join("text")
      // add half the size of the bar to center the text
      .attr("x", (d) => xScale(d.x0) + (xScale(d.x1) - xScale(d.x0)) / 2)
      .attr("y", (d) => yScale(yAccessor(d)) - 10)
      .text(yAccessor);

    // Draw Axis
    const xAxis = d3.axisBottom(xScale);

    const xAxisGroup = container
      .append("g")
      .style("transform", `translateY(${dimensions.containerHeight}px)`);

    xAxisGroup.call(xAxis);
  }

  // Select Handler
  d3.select("#metric").on("change", function (e) {
    e.preventDefault();

    histogram(this.value); // highlight-line
  });

  // default metric
  histogram('humidity') // highlight-line
}

draw("#chart");
The accessors, bars, scales and labels all depend on the data, so they go in the histogram() function.
And this works for the most part, however...
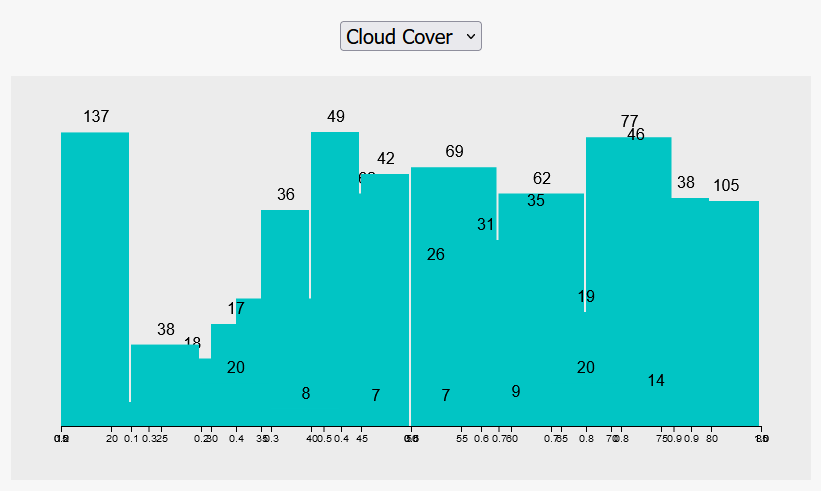
We are having an issue where the histogram function is adding new bars, axes and labels, without removing the old ones... we are just continuously stacking new groups of items on top.
To be more precise, every time we call the histogram function a new <g> group is being generated.
What we want to do is move the groups outside of the histogram() function so that the groups are only created once, and then modified on each subsequent call.
async function draw(el) {
  // Data
  const dataset = await d3.json("data.json");

  // Dimensions
  let dimensions = {
    width: 800,
    height: 400,
    margins: 50,
  };

  dimensions.containerWidth = dimensions.width - dimensions.margins * 2;
  dimensions.containerHeight = dimensions.height - dimensions.margins * 2;

  binPadding = 2;

  // Draw Image
  const svg = d3
    .select(el)
    .append("svg")
    .attr("width", dimensions.width)
    .attr("height", dimensions.height);

  const container = svg
    .append("g")
    .classed("container", true)
    .attr(
      "transform",
      `translate(${dimensions.margins}, ${dimensions.margins})`
    );

  // Element Groups
  const labelsGroup = container.append("g").classed("bar-labels", true);

  const xAxisGroup = container
    .append("g")
    .classed('axis', true)
    .style("transform", `translateY(${dimensions.containerHeight}px)`);

  const barsGroup = container.append("g").classed("bars", true);

  // Histogram Function
  // elements that rely on data go here
  function histogram(metric) {
    // Accessors
    const xAccessor = (d) => d.currently[metric];
    const yAccessor = (d) => d.length;

    // Scales
    const xScale = d3
      .scaleLinear()
      .domain(d3.extent(dataset, xAccessor))
      .range([0, dimensions.containerWidth])
      .nice();

    const bin = d3
      .bin()
      .domain(xScale.domain()) // data domain
      .value(xAccessor) // data values
      .thresholds(10); // number of buckets

    const binnedDataset = bin(dataset);
    console.log(binnedDataset);

    const yScale = d3
      .scaleLinear()
      .domain([0, d3.max(binnedDataset, yAccessor)])
      .range([dimensions.containerHeight, 0])
      .nice();

    // Draw Bars
    barsGroup  // highlight-line
      .selectAll("rect")
      .data(binnedDataset)
      .join("rect")
      //.attr('width', ((dimensions.containerWidth / binnedDataset.length) - binPadding))
      .attr(
        "width",
        (d) => d3.max([0, xScale(d.x1) - xScale(d.x0)]) - binPadding
      )
      .attr("height", (d) => dimensions.containerHeight - yScale(yAccessor(d)))
      .attr("x", (d) => xScale(d.x0))
      .attr("y", (d) => yScale(yAccessor(d)))
      .attr("fill", "#01c5c4");

    // Bar Labels
    labelsGroup // highlight-line
      .selectAll("text")
      .data(binnedDataset)
      .join("text")
      // add half the size of the bar to center the text
      .attr("x", (d) => xScale(d.x0) + (xScale(d.x1) - xScale(d.x0)) / 2)
      .attr("y", (d) => yScale(yAccessor(d)) - 10)
      .text(yAccessor);

    // Axis
    const xAxis = d3.axisBottom(xScale);

    xAxisGroup.call(xAxis); // highlight-line
  }

  // Select Handler
  d3.select("#metric").on("change", function (e) {
    e.preventDefault();

    histogram(this.value);
  });

  // default metric
  histogram("humidity");
}

draw("#chart");
Automated Amazon Reports
Automatically download Amazon Seller and Advertising reports to a private database. View beautiful, on demand, exportable performance reports.